Probing
the density of ping-responsive-hosts in each /8 IPv4 prefix and in
different sizes of BGP advertised prefix
Robin Whittle rw@firstpr.com.au 2007-03-29 (Links and
summary updated 2008-06-14 Internet Census 2012 site linked to on 2013-06-25)
To
the main IP
page
Please
check these other sites too . . .
2013-06-25 update:
Please take a look at the detailed material at this impressive project:
This may also be interesting too:
The remainder of this page is as I updated in on 2008-06-14:
The
Information Sciences Institute of the
University of
Southern California have conduct surveys and complete
censuses which pinged every
IPv4 address.
In
2007-02 they got positive responses from about 104.77 million
addresses, which is close to my 2007-03 estimate of
107,964,400
million ping-responsive hosts. In 2007-05 their figure was 112.25
million. See my note immediately below on Comcast IPv4 address
usage.
They
determined that ICMP probing (ping) was generally a better way of
finding hosts than using TCP probes. Table 4 shows that of a
random sample of Internet addresses, of those which responded to either
ICMP (ping) or TCP, 74% responded to ICMP and 62% responded to TCP.
My analysis and
further thoughts
Another
check of the effectiveness of ICMP and TCP was achieved by analysing
the traffic of the 81,664 IP addresses in their university
network, and by probing those addresses with ICMP and TCP (from Table
3):
IP addresses
% of 81,664 % of 27,586
Passive observation of traffic
with
shows IP address is used 25,706
31.5%
93.2%
Respond to ICMP (ping)
17,054
20.8% 61.8%
Respond to
TCP probe
14,794 18.1%
53.6%
Used IP addresses detected
by
any of the above means
27,586 33.8%
100.0%
Passive only
7,720
9.4%
28.0%
ICMP
only
656
0.8% 2.4%
TCP
only
1,081
1.3% 3.9%
What I would really
like to know is how many IP addresses are actually used in the Net . . .Note: 2008-06-14 regarding Comcast:
In June 2008, on the ARIN-PPML
list, in a discussion about IPv6 adoption and how much scope there is
for more utilization of IPv4 address space, Dan
Alexander (Engineer with Comcast, member of the ARIN Advisory
Committee) challenged the ability of anyone to see how the address
space is used, via ping or any other method. Please read his message,
of which perhaps the most important is: People continue to think that someone will be able to "see"
the whole (I)nternet. That it is a static, while growing,
thing that can be mapped. Since everyone likes to use
Comcast as a reference, here are some facts. Comcast has
more than 38 million active interfaces using RIR allocated
IP addresses. If you factor in re-use of private networks,
another 35 million IP are being used of RFC1918 space.
Your thoughts on utilization would imply that Comcast makes
up around 37% of the Internet.
I can't speak with authority, but I'm quite confident that
is not the case. Also keep in mind what you consider
"utilized". If you have a VLAN with a /26, and 50
interfaces connected, are the 50 IP utilized, or are all 64
now unusable anywhere else on the network. The 38 million
number I quote does not include subnet loss, aggregation,
capacity maintenance, or deployment plans.
is the second largest ISP in the USA. I wasn't suggesting that the ping
figures of 110M or so represents an accurate count of utilization,
however defined. The figure is surely some factor higher. I
guess 2
to 3 - but not 10 or 15. Maybe the truer figure is 400M. to 500M
IPv4 addresses actively used, at least some of the time, for traffic.
Still, this is of 1.7 billion addresses advertised to the
BGP routing
system, and probably 3.7 billion could be advertised with sufficient
demand for IPv4 space. I am not saying this is good enough for
ever -
just that IPv4 is not going to bust at the seams within a year or two
of the end of fresh space, around 2011. I still think that
IPv6-only services are so at odds with what end-users want
and need in
the foreseeable future, that there will be great pressure to make
better use of IPv4 for a long time yet. My RRG and PPML messages
around June 2008 explore some ways this might be achieved to a greater
degree than many IPv6 proponents consider likely. I can't
say for sure what will happen, but I think the discussion has been
useful. Be sure to see the discussion here
and here
with Alain Durand about Comcast's longer term plans for what might be
called an IPv6-only service. This "624" service (for the future
"Our service remains and will remain as long as possible classic IPv4")
uses an IPv6 access network to tunnel IPv4 packets to a centrally
located NAT box for IPv4, shared by multiple customers. This is a
single layer of NAT with without the uPnP NAT hole punching (used by
P2P programs and others) which is common on home broadband services
today. |
This
can't be determined reliably, since an IP address could be used by a
host which never sends or receives traffic packets, or responds to ICMP
or other types of probe. (Such addresses may be used within an
organisation, but not made available to the public Internet. This
seems a questionable use of an increasingly scarce public resource.)Not counting such "dormant" IP
addresses, how many IPv4 addresses are in use today?Perhaps
the best approach would be to somehow monitor traffic at a large number
of routers all around the Net, discarding packets resulting
from worm probing, to find those which are indicative of genuine
use of an IP address for sending and/or receiving traffic packets.
No-one has done this, and it would be difficult from a security
and privacy point of view to gather this data from a large number of
routers.Another
approach would be to try to determine how much ICMP (ping)
underestimates the true number of IP addresses in use. A feasible
approach might be as follows: - Monitor
traffic at one or more routers in a range of ISPs around the world,
collecting IP addresses which seemed to be involved in genuine traffic
- not just IP addresses which were the targets of worm probing etc.
- ICMP and TCP probe every one of these addresses -
as soon as possible afterwards, since some of these IP addresses might
not be active for very long.
This
would provide a reasonably accurate estimate of ICMP's under-counting
for a wide range of addresses, assuming the monitoring points handled
traffic to and from a wide range of IP addresses all over the world.
Since the ping survey and census gives robust figures of
about 110 million or so, the under-counting estimate could be
used to extrapolate to a moderately reliable estimate of the actively
used IP addresses for the whole Net.Using
the Table 3 information, the number of actively used IP addresses in
the university network was 1.62 times the number of
ping-responsive IP addresses (27,586 / 17,054 = 1.62)
. The broader Internet consists of many more university networks,
which may or may not be administered in a similar manner, and mainly
corporate networks, ISPs for consumer services and to provide
connectivity for businesses and government organisations.. . .
and how many could be used in the future?My
guess is that ICMP probably undercounts by a factor or 1.7 to 2 or
more. If we assume 2, then there are about 220 million active
IPv4 addresses in use today, of 1.7 billion BGP advertised
addresses. (See above, the true figure is
probably 400M or so.) This would be 13% utilization, so there is
significant
room for improvement when fresh supplies of IPv4 space run out in the
next few years. What is needed is a finer, light-weight, means of
slicing and dicing address space for end-users who require stable
addresses and who want to do multihoming (and perhaps traffic
engineering). Please see the Ivip page for a
future architecture for achieving this. About
3.7 billion addresses could be advertised, once all the unicast space
is allocated, assigned and advertised, a little over twice the current
figure of 1.7 billion. So if we allocated, assigned and
advertised almost all of the IPv4 address space, and found a way of
doubling the utilization rate, we could have four times the current
number of IPv4 addresses in active use in the future.
In
September 2007, Geoff Huston estimated (www.ripe.net/ripe/meetings/ripe-55/presentations/huston-ipv4.pdf)
that total address demand is doubling about every 10 years (page 12)
and that "Advertised address pools appear to have end host utilization
levels of around 5% -20%" (page 31). The
ISI project also generated an impressive
map, with each IP address as a single pixel at 600 pixels per
inch:
www.isi.edu/ant/address/whole_internet/
.
A
somewhat similar map of the Internet (IPv4), down to /24 resolution,
showing how the address space is broken up into BGP advertisements, is
available at:
There
are 4096x4096 png images of the situation every month since 2004.
I read about these on the low-volume Mapping-Cyberspace
discussion list
www.cybergeography.org/discussion.html.
Please
see discussion of IPv4 address utilization and how to make better use
of this space, in the IRTF Routing Research Group list, such as this
messages and following discussions:
psg.com/lists/rrg/2007/msg00578.html
.
Also, discussions on the RRG list on the total number of BGP
routers in the Default Free Zone:
msg00253,
msg00257,
msg00262 . This
includes some discussion of how many peers BGP routers have.
Main statistics
In
March 2007 I pinged a random sample of BGP advertised ( = "routed")
addresses, collecting only positive Acks, and analysing the response
rates according to the length of the advertised prefixes, in order to
estimate the total number of addresses which respond to ping, and the
distribution of ping-response rates for prefixes of different sizes.
Extrapolation
leads to an estimate of
107.96
million addresses which return an Ack after a single ping probe.
This would be an underestimate of the true number of used
addresses due to reasons including:
- Some or many hosts and
networks not responding to ping.
- Hosts being turned off at the
time.
- Some
organisations using the address space for internal uses, but not
advertising them on the Net. (I don't think this is a good way to
use public IPv4 space.)
There
may also be some overestimation, due to a few special security research
systems responding to ping on a large number of addresses, to attract
malicious activity. Also, a few probes and Acks may have been
lost.
This is
6.37% of the
advertised (routed) space
(1,694,827,520 IP addresses) and a smaller percentage of the
assigned space - space RIRs have assigned to ISPs and
end-users, not all of which is yet advertised in BGP.
Geoff
Huston's page:
www.potaroo.net/tools/ipv4/
indicates that in March 2007, about 147 /8's worth of space had been
assigned - 2,466,250,752 IP addresses. The ping-responsive
host rate is
4.38% of the assigned
space.
A
total of about 222 /8 prefixes can be assigned and used in IPv4 -
3,739,090,944 IP addresses. (0 to 223.0.0.0/8, not counting 10
and 127.) As a proportion of this, the ping-responsive-host rate
is
2.89%.
Introduction
Note
added May 2007: Quite a few experts in the field think that using ping
to try to estimate the usage of IP addresses is close to useless.
I am not convinced it is useless, but there are an unknown number
of computers and networks which do not respond to pings. Also,
there are a few artificial networks where every IP address responds to
pings, but the system is intended as a honeypot for hackers or some
other unusual purpose. Still, I think the differences in
ping-responsive-host density I find here can't be explained entirely by
the errors inherent in using ping. Other than trying more
aggressive probing techniques, which would generally be viewed as
hostile - which would have similar problems to ping -I can't think of a
better way of estimating actual utilisation of IPv4 addresses .
When fresh expanses of IPv4 addresses run out around 2012 many
enquiring minds will want to know how the already assigned space is
being used.
In
February 2007 I sent random ping packets to every IPv4 /8 prefix - one
every 5 seconds for every prefix, for about 24 hours.
I combined the results with information about what
proportion of each
prefix was advertised in the global BGP system, meaning these ranges of
addresses are operational and connected to the Internet. The
result
is, for each prefix 0.0.0.0/8 to 223.0.0.0/8, some indication of the
density of hosts (computers, routers etc.) as a percentage of the
"advertised" address space.
This
may be poor indication of the number of IP addresses which have a
computer or router connected to them, in active service, since many
computers, routers and modem-routers may be configured not to respond
to pings. Also, computers may be turned off when the test is
performed. Pinging seems to be the only obvious way of estimating
actual address usage, because the other schemes are tricky and error
prone too: such as
looking up reverse mappings of IP addresses and checking they resolve
to the IP address and look like a meaningful computer name (which might
be accessible via HTTP). Ten or more years ago, ping
response rates would have been a much better indication of "host
density", but today, an unknown number of computers are configured not
to respond to pings, for instance to reduce the chance they would be
targeted by attackers.
Even with the difficulties of extrapolating
ping
acknowledgements to genuine "host density", the pattern of responses
shows significant differences according to the address ranges surveyed.
I think these patterns are a reasonably reliable indication of
genuinely different
rates of usage of IP address space.
I
wanted to understand more about "host density" (the best I can do here
is "ping-responsive-host-density"), in
order to understand how well the IPv4 address space is being used.
Some ranges of addresses are reserved and can
never be used
for connecting to the Net. Of the remainder, some is reserved
by the IANA and
by the Regional Internet
Registries. The rest has been assigned to ISPs and large
Internet
users who operate Autonomous Systems. However, not all that
space is
"advertised".
At the bottom of this page is a coloured-in
text table of the results for each /8 division of the IPv4 address
space, from 1.0.0.0/8 to 223.0.0.0/8.
(The
plain text version of the results, with details of how I did it, is
here: host-density-per-prefix-analysis.txt
. An OpenOffice Calc spreadsheet I used is here: host-density-per-prefix-analysis.ods
.)
My
basic question was: If we are about to run out of fresh IPv4 addresses
in 2011 or so, and most of the available space has already been
allocated, then even considering that some of the allocated space is
not advertised, why (in early 2007) can I only find (by extrapolating
my results) about
108 million
computers on the
Net which respond to pings? The total estimated figure is
107,964,400 in the table below.
If
I found high utilisation of
currently advertised address space, then I could imagine that when all
the reserved space is allocated to users, and when users advertise all
their currently unadvertised space, that there would be a real
"crunch". However, unless a very high proportion
of computers do not respond to pings, then the results of
these ping tests mean I find that advertised address space is only
highly populated by computers in a minority of cases.
Following
this, I wrote some
software to probe sets of BGP advertised prefixes of different lengths,
/8 to /24. This revealed
some interesting distributions in the ping-responsive-host densities of
these prefixes. Below are some of the graphic
results.
First, some links to sub-directories of this one:
all-graphs/ This
contains all the graphs without any commentary.
software/
This contains descriptions of the software I wrote, a tarball of the
software and results, and a description of exactly how I created each
set of figures.
Copyright
2007 Robin Whittle Please link to this site or use parts of it
with proper attribution. Do not copy the whole thing!
Brief
account of ping-responsive-host-density for each length of BGP
advertised prefix
This table is
repeated below where I discuss it in greater detail.
It
shows the number of prefixes advertised, of each different length, on
27 March 2007.
For instance, there were 628 /14 prefixes advertised.
Column
5 shows what proportion of the advertised address space is covered by
prefixes of this length.
Column
7 shows my findings, which should be regarded as approximate (due to
time-of-day and day-of-week variation, for instance), of the proportion
of IP addresses covered by these prefixes which responded to ping,
during a 24 hour weekday test.
While there is uncertainty about how many IP addresses are
actually used but which do not respond to pings, I think those
uncertainties are far smaller than the differences in
"ping-responsive-host-density" we observe - so I suggest that the
actual address utilisation varies enormously between the various
lengths of prefix, in rough accordance with the figures shown here.
For
instance, it is easy to see that if the 19 /8s were used as intensively
as the /12s, that there would be 46 million more ping-responsive IP
addresses, which is 42.7% of what we observe at present. Overall,
on average, the prefixes have a much lower utilisation rate than I can
imagine could be achieved with better management. As supplies of
fresh IPv4 addresses run out around 2010/2012, pressure for better
management will increase.
Column
1 2 3 4
5 6 7
8 9 10
Percentage of total Approx
number of
Number advertised
advertised ping-responsive-hosts
\
space
in these prefixes
IP
addresses Prefix \
IP | Approx
ping- | % of total
per prefix
length | addresses |
responsive-
| 107,964,400
| Bits | |
| | host density
| p-r hosts
| | | |
| |
|
| |
16,777,216
24 /8 19 318,767,104 18.81%
0.273% 872,146 0.81%
8,388,608
23 /9 2 16,777,216 0.99%
5.288%
887,212 0.82%
4,194,304
22 /10 13 54,525,952 3.22%
9.362% 5,105,101 4.73%
2,097,152
21 /11 45 94,371,840 5.57%
9.215% 8,696,648 8.06%
1,048,576
20 /12 117 123,731,968
7.30% 14.748%
18,248,238 16.90%
524,288 19 /13 283 149,946,368 8.85%
11.499%
17,243,082 15.97%
262,144 18 /14 628 165,675,008 9.78%
8.167% 13,581,208 12.58%
131,072 17 /15 1578 206,176,256 12.17%
5.455% 11,247,945 10.42%
65,536 16 /16 5136 338,690,048 19.98%
3.836% 12,993,843 12.04%
32,768 15 /17 1948 64,716,800
3.82%
9.019% 5,837,002 5.41%
16,384 14 /18 3192 53,329,920
3.15%
9.971% 4,784,653 4.43%
8,192 13 /19 6676 55,787,520
3.29%
8.564% 4,778,089 4.43%
4,096 12 /20 6903 29,089,792
1.72%
8.073% 2,348,477 2.18%
2,048 11 /21 4200 8,955,904
0.53%
6.408% 573,894 0.53%
1,024 10 /22 5801 6,134,784
0.36%
6.038% 370,430
0.34%
512 9 /23 8263
4,322,304 0.26% 5.078%
219,499
0.20%
256 8 /24 14798
3,828,736 0.23% 4.621%
176,933
0.16%
128 7 /25 8
64 6 /26 3
32 5 /27 8
16 4 /28 7
8 3 /29 0
4 2
/30 1
2 1 /31 0
1 0 /32 3
Graphs
of distribution of ping-responsive-hosts in different length BGP
prefixes
Please
see the all-graphs.html link above for graphs of every prefix /8 to
/24. The following illustrates some of the contrasts. These
tests were done in late February and early March 2007.
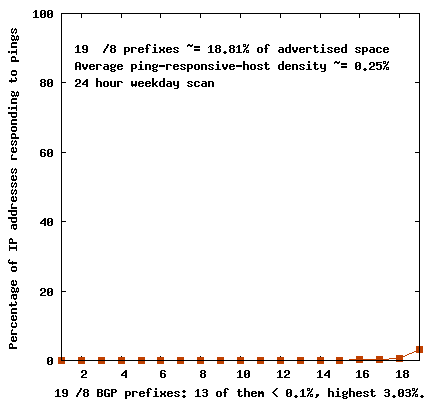
There
are 19 /8s advertised, for the IPv4 /8 prefixes X.0.0.0/8 where X = 3,
4, 8, 12, 15, 16, 17, 18, 32, 33, 35, 38, 44, 45, 53, 55, 57, 126 and
214. Many of them returned no pings, and I sent a ping to about
one in 971 IP addresses. The one with the greatest density (~3%)
was 12.0.0.0/24, assigned to AT&T.
The above graph
shows, in the vertical direction, the approximate ping-responsive-host
densities
of each of these /8s, when they are arranged left to
right in order of increasing ping-responsive-host density.
The
area below the
graph represents the utilisation of 18.92% of the BGP advertised IPv4
address space. On average their ping-responsive-host density is
about 0.21%
- much lower than for longer prefixes. This is the most
dramatic example of where there is room for improvement in IPv4 address
utilisation.
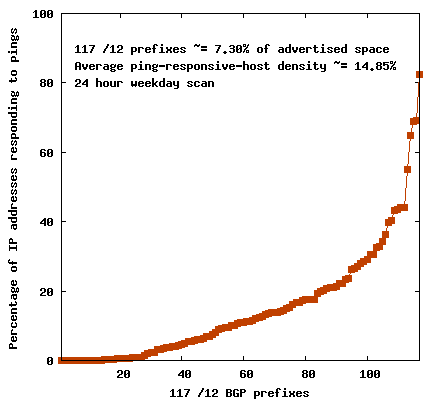
The
above plot shows the ping-responsive-host densities all the 117
advertised /12
prefixes, as with all these charts, arranged in ascending order left to
right. The /12s have the highest ping-responsive-host densities,
for some reason
- about 15%. /12 prefixes cover 7.28% of the advertised IPv4
address space.
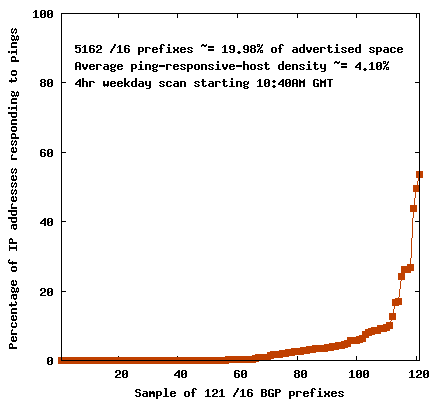
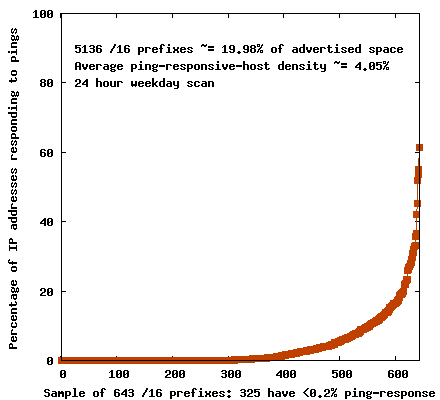
The
/16 prefixes cover 19.97% of advertised IPv4 address space and have the
worst average ping-responsive-host density (3.5 to 4%) apart from the
/8s. The second graph shows
the ping-responsive-host densities of all but one of 644 randomly
selected /16 prefixes, again
measured by acknowledgements to ping. I sent about 1100 pings to
each prefix, and each prefix covers 65536 IP addresses. The
highest result is for 158.99.0.0/16 with 1086 acks from 1088 pings.
This seems very high indeed, so I treat it as anomalous and have
removed it from the set of data for the graph.
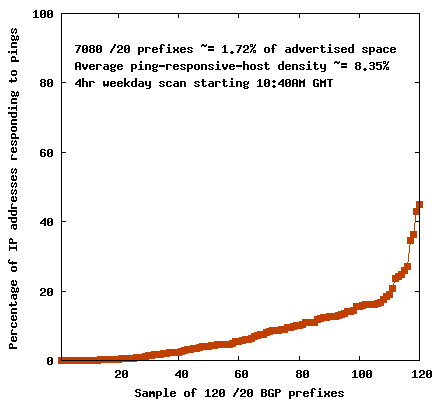
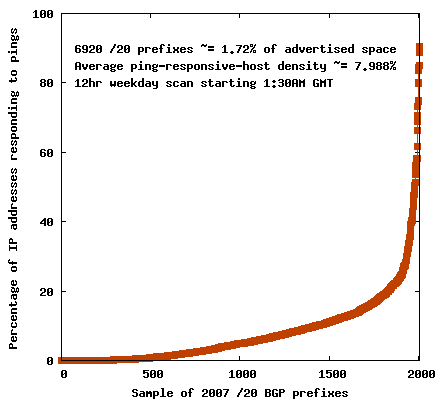
The
right graph is for a random sample of 2007 the ~6920 /20 prefixes,
which
cover 1.68% of advertised IPv4 address space. The average
ping-responsive-host density
for /20s is ~8%. The exact number of prefixes of a certain length
varies day-to-day. The scans for these graphs were done nearly a
month apart.
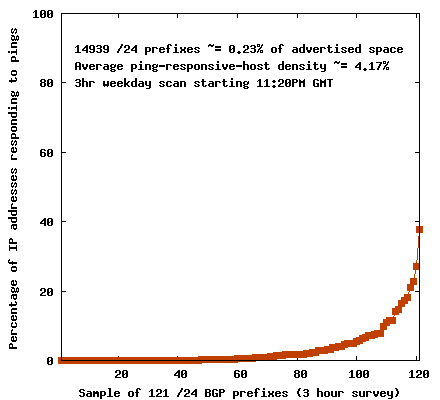
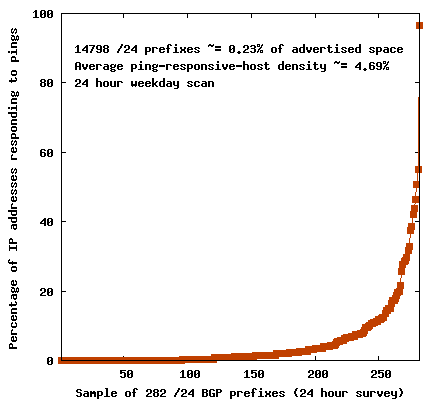
This
is the distribution of ping-responsive-host densities in /24 prefixes,
based
on random samples of 121 and 282 of the ~14798 /24s. These
prefixes only
cover 0.22% of the advertised address space, but they are the most
numerous set of BGP advertisements. The star performer in the
second sample acknowledges pings to 247 of its 256 IP addresses.
This is
207.171.235.0/24, with reverse mapped addresses indicating it is part
of an Alabama-based ISP:
www.farmerstel.com
. The first sample scanned in a 3 hour period at a time when most
businesses in Europe and America would have been unattended.
About
a third of these prefixes did not acknowledge a single ping. In
the second sample, this
was with a methodical sequence of pings to each of the 256 IP
addresses, spread over a 24 hour period. Perhaps some of these
prefixes are being used, with ping acknowledgements filtered out at the
router. Some of them have reverse mapped names which resolve to
the correct IP addresses, but many of the "ping unresponsive" prefixes
have no reverse mapped names at all. Probably some of this third
are being used.
It is hard to
quantify the results of this reverse mapping, but if you are curious,
here are the raw results:
reverse-dns-282-slash8s.zip
.
Just
because a prefix only has one or a few hosts
or routers connected to it doesn't mean that the organisation it is
assigned to is making unnecessarily inefficient use of the address
space. Perhaps they need to be multihomed and only need a
single IP address for their mail
server, VPN gateway, name server etc. with all their computers on a
private network behind this one IP address. The are probably using a
/24 because it is the smallest amount of address space they can
advertise on the global BGP system
Conclusions
I
estimated (in February) there were about 106.5 million IP
addresses responding to pings.
This means roughly this number of ping-responsive hosts
(computers or routers)
directly
connected to the net and turned on, on average, over this 24 hour
weekday period. There would be many more computers with
Internet
access, with one or potentially many behind the NAT firewall
implemented by a typical cable modem or ADSL modem. Those
modems,
if on, would typically respond to the ping packet and so be counted as
one 'host'. Some people who should know what they are talking
about tell me that most ADSL modems, or other devices which implement
NAT firewalls, typically don't respond to pings. However it is my
impression that many do respond to pings. I pinged
several /24 prefixes which were devoted to ADSL services and got
high response rates. Also - the cable block 24.0.0.0/8 -
has a high response rate.
There
are 224 /8 prefixes in IPv4 below the 224.0.0.0/4 prefix which is for
multicast. This can't be used for
ordinary
Internet access because software in all computers and routers would
need
to be changed to achieve this. I guess the same may be true
of
the last 1/16 of the address space, 240.0.0.0/4, which has always been
"reserved". These two prefixes tie up 32 /8 prefixes and
another
two are lost: 10.0.0.0 for private addressing and 127.0.0.0 for
referring to the local host (this always refers to the current
computer.) This leaves 222 /8 prefixes.
Geoff
Huston's report www.potaroo.net/tools/ipv4/
indicates that about 170 /8s have been allocated for use, which would
leave 52 in reserve, to be allocated in the future. The near
future, because allocations are currently running at about 12 /8s a
year.
I
knew that amongst this 170 allocated /8 prefixes, some were used
intensively, being split amongst various ISPs and users according to
recent policies, and that other prefixes had been allocated long ago -
often to a single organisation which was not an ISP - and were either
not used at all (that is, not advertised on BGP so routers can send
packets to them) or were being used very lightly, with only a small
number of computers connected to them.
I
couldn't find any recent information on host density (the proportion of
IP addresses with a computer connected to them) so I found out the best
I could myself with these ping programs.
Within
the 170 prefixes which have been allocated, I found 29, marked below in
purple, which are either not advertised at all on BGP or which have so
few ping-responsive-hosts connected that not a single one of my pings
was acknowledged.
I sent ping packets to one in every 971 IP addresses, so I
would
say that those prefixes which sent no acknowledgements probably have
fewer than one or two thousand ping-responsive-hosts connected to them.
I
guess
most of those marked in purple have none, but I have no way of being
sure.
There are a further 11 prefixes,
marked
below in dark
green which
are assigned to single organisations, where there the total number of
ping-responsive-hosts indicates that only a small proportion of the
whole prefix is
currently being used. As the RIRs run out of prefixes, I
imagine
there will be lots of pressure to use these most of the addresses in
these 11 prefixes, and all the 29 currently unused (as far as I can
tell) prefixes.
So
the conventional, formal, view is that there are 52 prefixes to go, and
we are chewing into them at about one a month. This gives
rise to
the ca. 2011 date for supplies of fresh IPv4 addresses coming
to
an end. One can imagine demand rising during that time, but
also
that policies would tighten. Geoff Huston's report maps the
proportion
of space which has been assigned to ISPs and large end-users, but which
has not yet been advertised. This proportion is slowly
dropping,
and one would expect it to drop further as supplies of fresh IP
addresses dry
up. His charts of what is not advertised would include those
prefixes I marked in bold
purple
which have not advertised any of their prefix. These "not
advertised" figures would also include much of what I have marked in dark
green and dark brown.
Yet some of the advertised space is clearly not being used
for
much, such as all the non-bold
purple prefixes, where most or all of
the space is advertised, but where I didn't get a single ping
acknowledgement.
I
have never read of any official policy on what might be done with the
29 + 11 subnets I have identified as assigned but either unused, or
very lightly used. It is possible to see how each prefix is
advertised by looking at the prefixes.txt file which I discuss below.
52 /8 prefixes gives us, in
theory, 4.33 years at the 12 a year rate I estimate from the graphs in
Geoff Huston's report.
Maybe there is
(29 + 11) / ~12 ~= 3.33
years more supply of IP addresses in the prefixes marked purple
and dark
green
below, but this is counting a lot of what Geoff Huston counts as
"unadvertised" space which has already been allocated. So this
space has already been considered in other discussions of IPv4
address exhaustion.
Maybe
these are not often mentioned, because there is no official policy
about using them, and because mentioning them might lead to greater
complacency about one of the major threats to the Internet: the looming
depletion of IPv4 address spaces.
The
Internet faces other major threats (not counting censorship
and
crime in general). Firstly, there is the growing problem of
millions of zombied Windows machines, which can be controlled by
hackers to perform all sorts of criminal acts. Secondly, there is
the
looming problem of how to keep the Internet's transit and border
routers going when more and more ISPs and end-users connect their
systems and the "global BGP routing table" becomes so large that
routers can't handle it in their hardware, and have difficulty
developing a stable view of how packets should be routed.
While
people are working on the later problem (including myself - see the
parent page ../) no-one has a
clue how to resolve the botnet zombie problem, or spam - which largely
depends on the zombied machines. As far as I can see, no-one has
any ideas about
IP
addresses either, but I think that as they run out, more and more
efficient use will be made of existing IP addresses. NAT
firewalls - which hide multiple computers behind one ADSL etc. modem
and destroy the Internet's principle of any-to-any direct
communications - are already widely used.
Perhaps,
more efficient use could be made of existing IP address space if ISPs
and end-users could split it into smaller prefixes, such as lots more
/24s, and advertise them freely without regard for route aggregation.
At present, most people think route aggregation is absolutely
essential for the routing system to survive. I think that in
hardware
terms, with new router designs, this is need no longer be the case -
but there
is still the problem of BGP handling a growing
number of routes.
Analysing
the
prefixes.txt routing table file
It is
possible to see how
each /8 prefix is advertised or not, usually in many smaller prefixes,
by
looking at the 4.6Mbyte prefixes.txt
file which I have archived here. This is from the daily
updated file bgp.potaroo.net/ipv4-stats/prefixes.txt
on 27 March2007. As I understand it, this represents the contents of
the BGP routing
table of a particular router.
Here
is a shell script to process the prefixes.txt into advertised prefixes
of different lengths, and to count how many of each such prefix there
are: prefix-process.sh
It produces prefixes-adv.txt
out.txt
which is the basis of the following list of distributions of
prefix
lengths. This table also contains results from a 24 hour weekday
ping survey on 27 to 28 March 2007, based on the prefixes.txt obtained
on the morning of 27 March 2007. The raw results are below.
The number of pings sent varies, due to the 24 hour time limit
and the variations in the approximately 1 second time it takes the ping
program to return.
Prefix Number of Pings
Acknowledgements
length prefixes sent
Number Percentage
|
| | |
|
8 19
85899 235 0.273
9
2 85625
4528 5.288
10
13 86620
8110 9.362
11
45 87333
8048 9.215
12
118 87760 12943
14.748
13 286
88265 10150 11.499
14
632 88137
7225 8.197
15 1573
88956 4853 5.455
16
5168 89299
3426 3.836
17
1975 89663
8087 9.019
18 3255
90662 8134 8.971
19
6810 91829
7865 8.564
20 7102
93197 7524 8.073
21
4373 93883
6016 6.408
22 5991
94465 5704 6.038
23
8442 94322
4790 5.078
24 14956
94217 4354 4.621
There
were a total of 1,694,827,520 IP addresses advertised.
The percentage of ping-responsive-hosts for the addresses
covered
by each set of prefixes of a given length has some striking differences.
27 March
2007
Column
1 2 3 4
5 6 7
8 9
10
Percentage of total
Approx number of
Number advertised
advertised ping-responsive-hosts
\
space
in these prefixes
IP addresses Prefix
\
IP | Approx
ping- |
% of total
per prefix
length | addresses |
responsive-
| 107,964,400
| Bits | |
| | host density
| p-r hosts
| | | |
| |
|
| |
16,777,216
24 /8 19 318,767,104 18.81%
0.273% 872,146 0.81%
08.txt 8,388,608
23 /9 2 16,777,216 0.99%
5.288%
887,212 0.82%
09.txt 4,194,304
22 /10 13 54,525,952 3.22%
9.362% 5,105,101 4.73%
10.txt 2,097,152
21 /11 45 94,371,840 5.57%
9.215% 8,696,648 8.06%
11.txt 1,048,576
20 /12 117 123,731,968
7.30% 14.748%
18,248,238 16.90%
12.txt
524,288 19 /13 283 149,946,368 8.85%
11.499%
17,243,082 15.97%
13.txt
262,144 18 /14 628 165,675,008 9.78%
8.167% 13,581,208 12.58%
14.txt
131,072 17 /15 1578 206,176,256 12.17%
5.455% 11,247,945 10.42%
15.txt
65,536 16 /16 5136 338,690,048 19.98%
3.836% 12,993,843 12.04%
16.txt
32,768 15 /17 1948 64,716,800
3.82%
9.019% 5,837,002 5.41%
17.txt
16,384 14 /18 3192 53,329,920
3.15%
9.971% 4,784,653 4.43%
18.txt
8,192 13 /19 6676 55,787,520
3.29%
8.564% 4,778,089 4.43%
19.txt
4,096 12 /20 6903 29,089,792
1.72%
8.073% 2,348,477 2.18%
20.txt
2,048 11 /21 4200 8,955,904
0.53%
6.408% 573,894 0.53%
21.txt
1,024 10 /22 5801 6,134,784
0.36%
6.038% 370,430
0.34%
22.txt
512 9 /23 8263
4,322,304 0.26% 5.078%
219,499
0.20%
23.txt
256 8 /24 14798
3,828,736 0.23% 4.621%
176,933
0.16%
24.txt
128 7 /25 8
25.txt
64 6 /26 3
26.txt
32 5 /27 9
27.txt
16 4 /28 7
28.txt
8 3 /29 1
29.txt
4 2
/30 2
30.txt
2 1 /31 0
1 0 /32 3
32.txtThere are text files listing all the
prefixes of each length.
The
/8, /9 and /10 lists are worth looking at in detail. The /8s
indicate a complete 1/212 of the public IP space is being directed to a
single router. This does not seem like the way to run a really
busy network. Most of the /8 prefixes I marked in purple
below, which
advertise on BGP, do so with a single prefix, indicating one router.
215.0.0.0/8 (US Dept. of Defense) only has half its space
advertised, and that is on a single /9. I marked that and all the
/8 single router prefixes with a '!'. The other /9 is the top
half of 73.0.0.0/8 (Mar05 ARIN) which I guess is still in the process
of being assigned
to users.
The /10s are pretty
big swaths of space, and two of
them - half a /8 - are found in the bottom half of 63.0.0.0/8
(Apr97 ARIN), so I wonder if that is half empty, since its
ping-responsive-host density
is about half that of its neighbours. I tried 1000 random pings and 29
acks came from the top half, which is advertised as 85 different
prefixes, and 1 from the bottom quarter and 5 from the second quarter.
So there's a 5:1 ratio in ping-responsive-host density between a
more ordinary
mix of advertised prefixes and these two /10s.
It is quite instructive to scroll through
the file prefixes-adv.txt , keeping an
eye on the left number. Some of them go by in a blink.
I
wonder about the host densities on some of these /8s which were
assigned to single organisations in the early 1990s. Does Bolt
Beranek and Newman (www.bbn.com)
really have about (100 + 22) * 917 ~= 110,000 computers on the
Net? Maybe, since they ran an ISP according to the WikiPedia
page. I hadn't heard of this Cambridge, Massachusetts, company - but
the WikiPedia article says: "Some of BBN's developments of note in the
field of computer networks are the implementation and operation of the
ARPANET; the first person-to-person network email sent and the
invention of the @ sign in an email address; the first Internet
protocol router; the Voice Funnel, an early predecessor of voice over
IP; and work on the development of TCP." The ISP (Genuity)was
sold and seems to be part of Level3. But would they run an entire
ISP
via a single BGP advertisement? Maybe if it was all in one
location. Does AT&T really have about 523 * 971 ~=508,000
computers on the net, all via one BGP advertised router?
38.0.0.0/8 is "Sep94 Performance Systems International" was an
early US ISP, purchased by Cogent. I suppose they could have
67 x 971 ~= 65k computers running from one /8 link. If so, they
are doing their bit for address aggregation!
Each
/10 is 4 million IP addresses. I will assume that the /8s,
/9s and /10s
in the list above are generally place holders, and that the traffic and
ping-responsive-host density per million IP addresses in these is very
low.
Together, they constitute 390,070,272 IP addresses. Of the
total 1,685,204,992 advertised (this is a late February figure,
somewhat different from the late March figures used in the table and
graph above), this leaves 1,295,134,720 advertised IP
addresses in the /11 to /24 prefixes. From the /8s prefixes which
were advertised as single /8s, I received 816 of the total 109,734 ping
acknowledgements. I will focus attention on the remaining 108,918
acknowledgements I received from these 1,295,134,720 IP addresses.
(Probably it would be found that the /11 and /12 single
advertisements also represented parts of the IP address space which are
not heavily used, either by host count or traffic, at present.)
In
late February 2007, I
sent pings to one in 971 IP addresses for each of the /8 prefixes
1.0.0.0/8 to 223.0.0.0/8. This indicates there were
108,918 * 971= 105.7 million ping-responsive hosts in 1.295 billion IP
addresses
advertised with /11 to /24
prefixes. That is an average
ping-responsive-host density of 8.16%. Yet some
complete /8 prefixes had markedly higher densities, the highest
being 36.41% for 71.0.0.0/8.
I
measured the ping-responsive-host density of 282 /24s by pinging every
address in each
one, in a randomised sequence, over a 24 hour period. The 282
were selected evenly from the prefixes-adv-24.txt
which which was about 2 days old by the time I ran the test (in late
February 2007). (I used a
text editor to keep a line, delete two pages of lines, keep a line etc.
so the sample was spread across the address range.) A check of some of
these prefixes which returned no acknowledgements showed they were
still marked as advertised in the more up-to-date prefixes.txt file
generated at bgp.potaroo.net/ipv4-stats/prefixes.txt
while the
test was being run, so I don't think the non-responses were related
much to some of these prefixes being unadvertised by the time I did the
test. The average ping-responsive-host density for the /24 prefixes I tested was 4.83%. This test was for a
reasonable sample of specific prefixes.
There was a lot of scatter in the
distribution. Of the 282 /24 prefixes I scanned:
- 96
(34%) gave no acknowledgements, so it is reasonable to think most of
them had no hosts connected to them.
- 79 (28%) gave
1 to 4 acknowledgements.
- 219 (77.7%) gave below the average
(4.83%) of acknowledgements.
- Only 66 (23.4%) gave a higher rate
of acknowledgements than the 8.16% average for prefixes /11 to /24.
- 16
(5.6%) had acknowledgement rates above 20%, with the five highest being
42, 44, 51, 55 and 96% (207.171.235.0/24).
If
it turns out that a significant proportion of these /24 prefixes
actually have no computers connected to them, such as 20 to 30%, then
it would seem that more judicious advertising of these /24 prefixes
could reduce their numbers in the global BGP routing
table considerably, without affecting Internet traffic.
Further
work
It
would be interesting to survey traffic on some widely distributed
transit
routers to find out the distribution of destination prefixes for which
the packets are sent from and addressed to. That would indicate the
sort of work done by routers in
forwarding the packets. By finding out the ping-responsive-host
density on the
particular subnets, it would be possible to analyse how much traffic
per IP address is generated on particular prefixes, to try to find
instances where reasonably good management has lead to not many IP
addresses being wasted.
Links
to other resources
Please see the
pages I list at the start of this page. Geoff
Huston's sites
www.potaroo.net
,
bgp.potaroo.net
and
www.cidr-report.org
contain a wealth of information, including reports with graphics which
are updated every day. He also has informative articles,
Internet
Drafts, RFCs etc. His report on IPv4 address space
utilisation
(and therefore looming exhaustion around 2011 or so) has graphs and
stats -
www.potaroo.net/tools/ipv4/
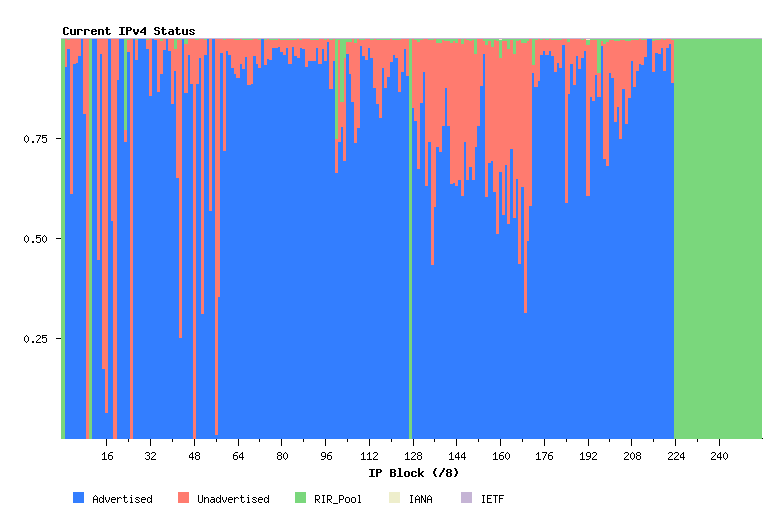
and a
great
graphic which displays the current status of the entire IPv4
address space, in a single chart.
- statistics
A graphic display of each prefix, showing how much of the address space
is assigned and advertised in BGP, assigned but not advertised, or
reserved by the IANA and RIRs.
- ipv4-activeblocks-statistics.txt
A text version of this, which I used as part of my analysis.
Ping-responsive-host
density of each /8 prefix 1 to 223
I
have colour coded some of the lines:
Red (52) - IANA
reserved but presumably could be used in the future.
Purple
(29)- Assigned to an organisation but I didn't get a single
acknowledgement to the 17820 random pings I sent to this prefix, so my
guess is that there are very few, if any, hosts using it.
Some of
these prefixes are not advertised in BGP, so we know they are not used
for Internet access. Their descriptions are in bold.
Others are partly or fully advertised, but I still found no
ping-responsive-hosts. On average, the pings reached one in every
971 IP
addresses, so if there are less than a few thousand active
ping-responsive hosts on the
prefix, it would not be surprising if I missed them. My main
interest in these prefixes is that it would probably not be too much
fuss for the IANA to allocate them for general use, once it runs out of
unused prefixes currently officially held in reserve. Maybe
the
organisations which have the prefixes would give them up and get some
publicity - for feeding the world's insatiable desire for IP addresses
for about a month. (See Geoff Huston's site www.potaroo.net/tools/ipv4/ for
stats and graphs of how about 12 prefixes a year are currently being
handed out to RIRs who assign them to users such as ISPs and large
organisations who are Autonomous Systems.)
Dark green
(11) - Prefixes assigned to a single organisation, with some
ping-responsive hosts, but
not very many. Unless there are large numbers of hosts using it,
with their ping responses disabled, then I guess that most of this
space could be used
in
the future for the RIRs to assign to other users. I have
included
defense departments in this, because I don't see why they need a whole
prefix. It is hard to imagine how a single router would handle
the traffic of very large numbers of computers, so the most likely
situation is that these /8s genuinely have host densities which are far
below average.
Dark
brown
(5) - This is an arbitrary set of prefixes which were allocated over
ten years ago and which seem to be very under-utilised.
Grey - can
never be used for Internet access. Localhost and the
10.0.0.0/8 private addresses.
Late
February 2007
Acks from
% ack Number
of Host density as
a 17820 pings
rate /24 prefixes percentage of
multiply by
/
advertised
advertised IP971 to get
| in
BGP
addresses~number of
|
| / hosts
\
|
|
/
\
|
| |
Prefix
| |
|
|
| |
|
| |
000
0
0
0
0 Sep81
IANA -
Reserved
001
0
0
0
0 Sep81
IANA -
Reserved
002
0
0
0
0 Sep81
IANA - Reserved
003
0
0
65536!
0 May94 General
Electric
Company (not adv 2007-07-25)
004
100 0.5787
65536!
0 Dec92 Bolt Beranek
and Newman Inc.
005
0
0
0
0 Jul95
IANA - Reserved
006
3 0.0174
1924
0.59 Feb94 Army Information Systems Center
007
0
0
1
0 Apr95
IANA - Reserved
008
22 0.1273
65536!
0.13 Dec92 Bolt Beranek and Newman
Inc. 009
63
0.3646 257
92.97 Aug92 IBM
010
0
0
0
0 Jun95
IANA - Private Use [RFC1918] 011
0
0
0
0 May93 DoD
Intel Information Systems
012
523 3.0266
65536!
3.03 Jun95 AT&T Bell
Laboratories
013
0
0
2828
0 Sep91 Xerox
Corporation
014
0
0
0
0 Jun91 IANA - Public
Data Network
015
0
0
65536!
0 Jul94
Hewlett-Packard
Company
016
0
0
65536!
0 Nov94 Digital
Equipment Corporation (RIP) 017
1 0.0058
65536!
0.01 Jul92 Apple Computer
Inc.
018
21 0.1215
65536! 0.12 Jan94
MIT
019
0
0
0
0 May95 Ford
Motor Company
020
0
0
17619
0 Oct94 Computer
Sciences Corporation 021
0
0
0
0 Jul91 DDN-RVN
022
0
0
0
0 May93 Defense
Information Systems Agency
023
0
0
0
0 Jul95
IANA - Reserved
024
2719 15.7350
58541 17.62 May01 ARIN - Cable
Block (Cable modems) 025
0
0
257
0 Jan95 UK Ministry
of Defense Updated 06 026
0
0
0
0 May95 Defense
Information Systems Agency
027
0
0
0
0 Apr95
IANA - Reserved
028
0
0
0
0 Jul92 DSI-North
029
0
0
0
0 Jul91 Defense
Information Systems Agency
030
0
0
0
0 Jul91 Defense
Information Systems Agency
031
0
0
0
0 Apr99
IANA - Reserved
032
7 0.0405
65536!
0.04 Jun94 Norsk
Informasjonsteknology
033
1 0.0058
65536!
0.01 Jan91 DLA Systems Automation Center
034
0
0
304
0 Mar93 Halliburton
Company
035
12 0.0694
65536!
0.07 Apr94 MERIT Computer Network
036
0
0
0
0 Jul00
IANA - Reserved Was Stanford 037
0
0
0
0 Apr95
IANA - Reserved
038
67 0.3877
65536!
0.39 Sep94 Performance Systems International
039
0
0
0
0 Apr95
IANA - Reserved
040
0
0
13206
0 Jun94 Eli Lily
and Company
041
91 0.5266
7607
4.54 Apr05
AfriNIC
042
0
0
0
0 Jul95
IANA - Reserved
043
15
0.0868 4096
1.39 Jan91 Japan Inet
044
0
0
65536!
0 Jul92 Amateur
Radio Digital Communicat 045
0
0
65536!
0 Jan95 Interop
Show
Network
046
0
0
0
0 Dec92 Bolt
Beranek and Newman Inc.
047
0
0
14401
0 Jan91
Bell-Northern
Research
048
0
0
0
0 May95 Prudential
Securities Inc.
049
0
0
0
0 May94 Joint
Technical Command} Returned to050
0
0
0
0 May94 Joint
Technical Command} IANA Mar 98 051
0
0
0
0 Aug94 UK
Deparment of Social Security
052
0
0
199
0 Dec91 E.I. duPont
de Nemours and Co. 053
0
0
65536!
0 Oct93 Cap Debis
CCS
054
0
0
0
0 Mar92 Merck
and Co. Inc.
055
0
0
65536!
0 Apr95 Boeing
Computer
Services
056
0
0
179
0 Jun94 U.S. Postal
Service
057
3 0.0174
65536! 0.02 May95 SITA
(Policy)
058
1642 9.5023
61738
10.09 Apr04
APNIC
059
1524 8.8194
46873
12.33 Apr04
APNIC
060
1367 7.9109
64533
8.03 Apr03
APNIC
061
1686 9.7569
64270
9.95 Apr97
APNIC
062
1226 7.0949
60555
7.68 Apr97 RIPE
NCC
063
729 4.2188
63731
4.34 Apr97
ARIN
064
1793 10.3762
59454
11.44 Jul99
ARIN
065
1751 10.1331
62473
10.63 Jul00
ARIN
066
2348 13.5880
62467
14.26 Jul00
ARIN
067
1767 10.2257
46828
14.31 May01
ARIN
068
3258 18.8542
64816
19.06 Jun01
ARIN
069
3084 17.8472
57832
20.22 Aug02
ARIN
070
3485 20.1678
63088
20.95 Jan04
ARIN
071
5984 34.6296
62325
36.41 Aug04
ARIN
072
3582 20.7292
58678
23.15 Aug04
ARIN
073
1637 9.4734
57737
10.75 Mar05
ARIN
074
2987 17.2859
49341
22.96 Jun05
ARIN
075
2020 11.6898
46475
16.48 Jun05
ARIN
076
884 5.1157
31273
10.72 Jun05
ARIN
077
355 2.0544
41909
3.21 Aug06 RIPE
NCC
078
0
0
0
0 Aug06 RIPE
NCC
079
85
0.4919 264
122.11 Aug06 RIPE
NCC
080
2020 11.6898
61549
12.45 Apr01 RIPE
NCC
081
2062 11.9329
61500
12.72 Apr01 RIPE
NCC
082
1938 11.2153
63724
11.53 Nov02 RIPE
NCC
083
2870 16.6088
63535
17.13 Nov03 RIPE
NCC
084
2957 17.1123
63847
17.56 Nov03 RIPE
NCC
085
1884 10.9028
60031
11.9 Apr04 RIPE
NCC
086
1439 8.3275
55160
9.89 Apr04 RIPE
NCC
087
1742 10.0810
61303
10.78 Apr04 RIPE
NCC
088
2058 11.9097
59899
13.03 Apr04 RIPE
NCC
089
1455 8.4201
57466
9.60 Jun05 RIPE
NCC
090
843 4.8785
37256
8.58 Jun05 RIPE
NCC
091
342 1.9792
42856
3.03 Jun05 RIPE
NCC
092
0
0
0
0 Sep81
IANA -
Reserved
093
0
0
0
0 Sep81
IANA -
Reserved
094
0
0
0
0 Sep81
IANA -
Reserved
095
0
0
0
0 Sep81
IANA - Reserved
096
1
0.0058
368 1.03 Oct06
ARIN
097
0
0
1
0 Oct06
ARIN
098
0
0
448
0 Oct06
ARIN
099
0
0
0
0 Oct06
ARIN
100
0
0
0
0 Sep81
IANA -
Reserved
101
0
0
0
0 Sep81
IANA -
Reserved
102
0
0
0
0 Sep81
IANA -
Reserved
103
0
0
0
0 Sep81
IANA -
Reserved
104
0
0
0
0 Sep81
IANA -
Reserved
105
0
0
0
0 Sep81
IANA -
Reserved
106
0
0
0
0 Sep81
IANA -
Reserved
107
0
0
0
0 Sep81
IANA -
Reserved
108
0
0
0
0 Sep81
IANA -
Reserved
109
0
0
0
0 Sep81
IANA -
Reserved
110
0
0
0
0 Sep81
IANA -
Reserved
111
0
0
0
0 Sep81
IANA -
Reserved
112
0
0
0
0 Sep81
IANA -
Reserved
113
0
0
0
0 Sep81
IANA -
Reserved
114
0
0
0
0 Sep81
IANA -
Reserved
115
0
0
0
0 Sep81
IANA - Reserved
116
0
0
265
0 Jan07
APNIC
117
0
0
265
0 Jan07
APNIC
118
0
0
265
0 Jan07
APNIC
119
0
0
265
0 Jan07
APNIC
120
0
0
265
0 Jan07
APNIC
121
788 4.5602
54648
5.47 Jan06
APNIC
122
572 3.3102
42720
5.08 Jan06
APNIC
123
76 0.4398
28737
1.00 Jan06
APNIC
124
1308 7.5694
51755
9.58 Jan05
APNIC
125
1919 11.1053
62788
11.59 Jan05
APNIC
126
59 0.3414
10240
2.18 Jan05
APNIC
127
0
0
0
0 Sep81
IANA - Localhost
128
550 3.1829
48500
4.30 May93 Various
Registries
129
315 1.8229
47774
2.50 May93 Various
Registries
130
290 1.6782
45707
2.41 May93 Various
Registries
131
154 0.8912
50604
1.15 May93 Various
Registries
132
265 1.5336
58064
1.73 May93 Various
Registries
133
55 0.3183
37459
0.56 May93 Various
Registries
134
252 1.4583
45014
2.12 May93 Various
Registries
135
3 0.0174
25494
0.04 May93 Various Registries
136
25 0.1447
20040
0.47 May93 Various
Registries
137
151 0.8738
46597
1.23 May93 Various
Registries
138
81 0.4688
40164
0.76 May93 Various
Registries
139
110 0.6366
31643
1.32 May93 Various
Registries
140
141 0.8160
36860
1.45 May93 Various
Registries
141
357 2.0660
47558
2.85 May93 Various
Registries
142
172 0.9954
33254
1.96 May93 Various
Registries
143
54 0.3125
42514
0.48 May93 Various
Registries
144
80 0.4630
38111
0.80 May93 Various
Registries
145
48 0.2778
47598
0.38 May93 Various
Registries
146
124 0.7176
36428
1.29 May93 Various
Registries
147
105 0.6076
42220
0.94 May93 Various
Registries
148
79 0.4572
33249
0.90 May93 Various
Registries
149
49 0.2836
44877
0.41 May93 Various
Registries
150
77 0.4456
35118
0.83 May93 Various
Registries
151
346 2.0023
41130
3.19 May93 Various
Registries
152
129 0.7465
40292
1.21 May93 Various
Registries
153
8 0.0463
11812
0.26 May93 Various Registries
154
32 0.1852
14400
0.84 May93 Various
Registries
155
61 0.3530
40722
0.57 May93 Various
Registries
156
56 0.3241
17101
1.24 May93 Various
Registries
157
70 0.4051
35796
0.74 May93 Various
Registries
158
77 0.4456
39224
0.74 May93 Various
Registries
159
41 0.2373
32081
0.48 May93 Various
Registries
160
67 0.3877
34129
0.74 May93 Various
Registries
161
53 0.3067
30430
0.66 May93 Various
Registries
162
92 0.5324
18960
1.84 May93 Various
Registries
163
95 0.5498
33416
1.08 May93 Various
Registries
164
98 0.5671
33538
1.11 May93 Various
Registries
165
96 0.5556
32753
1.11 May93 Various
Registries
166
99 0.5729
34900
1.08 May93 Various
Registries
167
46 0.2662
30115
0.58 May93 Various
Registries
168
142 0.8218
42218
1.28 May93 Various
Registries
169
42 0.2431
16084
0.99 May93 Various
Registries
170
34 0.1968
30649
0.42 May93 Various
Registries
171
25 0.1447
5433
1.75 May93 Various Registries
172
570 3.2986
22785
9.49 May93 Various
Registries
173
0
0
0
0 Apr03
IANA -
Reserved
174
0
0
0
0 Apr03
IANA -
Reserved
175
0
0
0
0 Apr03
IANA -
Reserved
176
0
0
0
0 Apr03
IANA -
Reserved
177
0
0
0
0 Apr03
IANA -
Reserved
178
0
0
0
0 Apr03
IANA -
Reserved
179
0
0
0
0 Apr03
IANA -
Reserved
180
0
0
256
0 Apr03
IANA -
Reserved
181
0
0
0
0 Apr03
IANA -
Reserved
182
0
0
0
0 Apr03
IANA -
Reserved
183
0
0
0
0 Apr03
IANA -
Reserved
184
0
0
0
0 Apr03
IANA -
Reserved
185
0
0
0
0 Apr03
IANA -
Reserved
186
0
0
0
0 Apr03
IANA -
Reserved
187
0
0
0
0 Apr03
IANA - Reserved
188
0
0
256
0 May93 Various
Registries
189
1073 6.2095
21918
18.57 Jun05
LACNIC
190
357 2.0660
14655
9.24 Jun05
LACNIC
191
0
0
0
0 May93 Various
Registries
192
124 0.7176
22052
2.13 May93 Various
Registries
193
528 3.0556
50843
3.94 May93 RIPE
NCC
194
448 2.5926
52961
3.21 May93 RIPE
NCC
195
731 4.2303
60410
4.59 May93 RIPE
NCC
196
202 1.1690
13543
5.66 May93 Various
Registries
197
0
0
0
0 May93
IANA - Reserved
198
231 1.3368
36114
2.43 May93 Various
Registries
199
189 1.0938
34049
2.11 May93
ARIN
200
1089 6.3021
57923
7.13 Nov02
LACNIC
201
1329 7.6910
51910
9.71 Apr03
LACNIC
202
818 4.7338
53148
5.84 May93
APNIC
203
932 5.3935
55167
6.41 May93
APNIC
204
323 1.8692
45880
2.67 Mar94
ARIN
205
251 1.4525
41012
2.32 Mar94
ARIN
206
410 2.3727
55319
2.81 Apr95
ARIN
207
807 4.6701
57260
5.35 Nov95
ARIN
208
632 3.6574
56211
4.26 Apr96
ARIN
209
1136 6.5741
57780
7.46 Jun96
ARIN
210
955 5.5266
61672
5.87 Jun96
APNIC
211
1527 8.8368
63272
9.15 Jun96
APNIC
212
1045 6.0475
59578
6.65 Oct97 RIPE
NCC
213
1248 7.2222
59723
7.93 Mar99 RIPE
NCC
214
0
0
65536!
0 Mar98 US-DOD
215
0
0
32768!
0 Mar98 US-DOD
216
1671 9.6701
60454
10.48 Apr98
ARIN
217
1544 8.9352
62673
9.34 Jun00 RIPE
NCC
218
2297 13.2928
64446
13.52 Dec00
APNIC
219
2382 13.7847
65003
13.90 Sep01
APNIC
220
2334 13.5069
61651
14.36 Dec01
APNIC
221
2179 12.6100
65153
12.68 Jul02
APNIC
222
1951 11.2905
64849
11.41 Feb03
APNIC
223
0
0
64849
0 Apr03
IANA - Reserved