2011 Japanese Nuclear Crisis
Click this link to go straight to the Wind Prediction section, which has a link to the Finnish Meteorological Institutes's up-to-date and easy-to-view wind predictions for the next 36 hours.2011-04-02 Robin Whittle rw@firstpr.com.au
Introduction
The earthquake and tsunami have been a
terrible calamity, with the death-toll at in the tens of
thousands and perhaps more. Large parts of some towns and cities
have
been devastated.
This page, and the related discussion forum:
is devoted to providing information about the nuclear crisis, which currently centres on the damaged reactors Units 1, 2, 3 and 4, in the Fukushima Dai-Ichi nuclear power plant, (http://en.wikipedia.org/wiki/Fukushima_I_Nuclear_Power_Plant) on the north-east coast of Honshu. Anyone can read the forum. Anyone with a Google account can join and post messages.
The main English Wikipedia articles which are devoted to this crisis are these pages (see the left of these articles for versions in other languages):
and I suggest these be used as the primary source of information. The material below is intended to support discussions and preparedness in general - to do things which the Wikipedia page, being encyclopedic and necessarily fussy about copyright, can't do.
Please write to me at rw@firstpr.com.au if you can suggest any links or images to put here. Please also join and contribute to the discussion forum mentioned above.
This page is done in a hurry, so its a bit rough. I have no formal qualifications in any field whatsoever. The information below is provided free - with a money-back guarantee.
Contents
| wind |
Wind
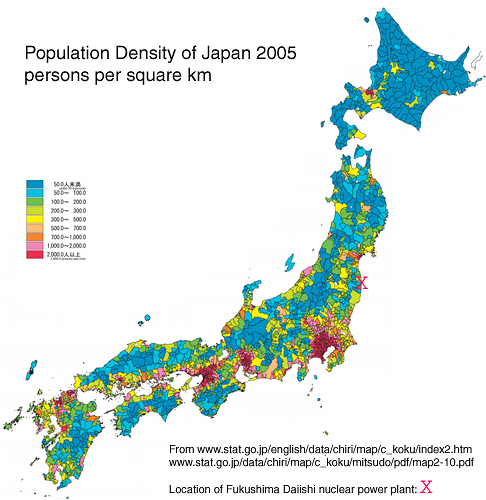
directions. The wind is the primary variable which determines how
many people are exposed to the radiation emitted by the reactors. |
| radiation |
Real time radiation monitors and comparison of various rates of radiation exposure. |
| weather |
Weather predictions. |
| news |
News sites. |
| techsites |
Sites with good technical
information. |
| videos |
Videos. |
| forums |
Other substantial discussion
forums. |
| decayheat |
Understanding this crisis
requires an understanding of the decay heat of the nuclear fuel. |
| images |
Photos, diagrams, population
density maps etc. |
| latest |
Latest developments and a few
comments. |
| dangers |
A note that nuclear reactors are
not the only source of radiation - burning coal may release a lot more
than the reactors. |
[#wind]
Wind predictions and current observations
The most important thing to watch is wind predictions. By
the time the wind is blowing radiation towards you, it will be too late
to leave - too many people will be trying to do the same thing.
Then, the best thing to do is to stay inside, shut the doors and
windows and seal the gaps in them, and any ventilators, with tape,
paper, towels or whatever.
Perhaps the easiest to view of the predictions are the four charts from Finnish Meteorological Institute:
This page explains the meaning of the images well. Predictions are updated every 12 hours and attempt to predict only 36 hours into the future. The four images show the predicated path of air emitted at four different times, at 6 hour spacings.
Once the animation has stopped, running your cursor over the date-time list on the right will step the images through these dates and times. Add 9 hours to UTC to get Japanese time.
The Wikipedia page has a section on wind prediction:
On the afternoon of Sunday 2011-03-20 this section had an animated gif of a NOAA HYSPLIT model predicting winds to 25 March. Note that the arrows in that animation point to the direction the wind is coming from. The wind direction is in the direction opposite these arrows. I haven't figured out how to use the HYSPLIT site to reliably generate something such as this image. So I suggest using the above predictive charts from Finland initially, and checking back on this section of the Wikipedia article to see if someone has an updated .gif they created with HYSPLIT.
A map showing recent wind observations for the region north of Tokyo, where the reactors are situated. The reactor site is just to the left and slightly below the "F" of Fukushima:
Below is an archived copy, from 2011-03-15 20:00 JST, with the reactor site shown.
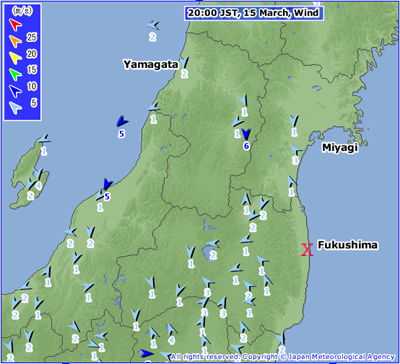
Similarly, for the Tokyo region, which is to the south. About 20% of the bottom of the above map overlaps with the top 20% of this map:
The overall map for Japan is:
See also Jeff Masters' WunderBlog, where he analyses wind predictions:
Also, the Austrian Weather Service http://www.zamg.ac.at/ runs daily predictions of the path taken by winds from the power plant. Look for "Fukushima" under "Neue Informationen".
Perhaps the easiest to view of the predictions are the four charts from Finnish Meteorological Institute:
This page explains the meaning of the images well. Predictions are updated every 12 hours and attempt to predict only 36 hours into the future. The four images show the predicated path of air emitted at four different times, at 6 hour spacings.
Once the animation has stopped, running your cursor over the date-time list on the right will step the images through these dates and times. Add 9 hours to UTC to get Japanese time.
The Wikipedia page has a section on wind prediction:
On the afternoon of Sunday 2011-03-20 this section had an animated gif of a NOAA HYSPLIT model predicting winds to 25 March. Note that the arrows in that animation point to the direction the wind is coming from. The wind direction is in the direction opposite these arrows. I haven't figured out how to use the HYSPLIT site to reliably generate something such as this image. So I suggest using the above predictive charts from Finland initially, and checking back on this section of the Wikipedia article to see if someone has an updated .gif they created with HYSPLIT.
A map showing recent wind observations for the region north of Tokyo, where the reactors are situated. The reactor site is just to the left and slightly below the "F" of Fukushima:
Below is an archived copy, from 2011-03-15 20:00 JST, with the reactor site shown.
Similarly, for the Tokyo region, which is to the south. About 20% of the bottom of the above map overlaps with the top 20% of this map:
The overall map for Japan is:
See also Jeff Masters' WunderBlog, where he analyses wind predictions:
Also, the Austrian Weather Service http://www.zamg.ac.at/ runs daily predictions of the path taken by winds from the power plant. Look for "Fukushima" under "Neue Informationen".
[#radiation]
Radiation levels and real-time monitors
A site which is supposed to report
radiation levels in real-time:
has some limitations. (The following notes are from 2011-03-18.) Firstly, many prefectures have no sensors. Secondly, in some prefectures which do, including Fukushima and to the north, Miyagi, there are no results. They are depicted as "under survey". It is unclear whether this is due to official suppression of figures, or to the entire sensor network in each prefecture not working.
Two non-official sites concerning radiation levels are:
This page http://www.pref.tochigi.lg.jp/kinkyu/houshasen.html links to a PDF (with an name which depends on the date and time) the most recent radiation readings in Utsunomiya, the capital of Tochigi prefecture, about 150km to the south-west of Fukushima Dia-Ichi. I have not been able to read these PDFs. I found it convenient to open the above page with Google's Chrome browser, which offered an English translation. The second green heading and the text which follows, is translated by Google into the following:
Even without translation, using Firefox, these figures are visible amongst the Japanese characters.
Radiation measurements are in the past - and safety decisions need to be made according to our expectations of the future. The wind could change and the emissions from the reactors could change. So I think it is vital to avoid being downwind of the reactors . . . but what distances should we worry about? I have no idea, since no-one knows how much radiation the reactors will be putting out. We don't even have a clear idea of how much radiation the reactors have emitted so far, since most of it has been blown out to sea. Since the reactors could emit more, due to explosions, meltdowns or deliberate or accidental release of radioactive steam or other gasses, no-one can reliably predict what they will emit.
The figures at the above site are in nanogray per hour (nanojoules of energy per kilogram of absorbing material, per hour. According to http://en.wikipedia.org/wiki/Ionizing_radiation#Units the gray and the sievert are different types of unit, so there is no direct conversion between nanograys or similar and microsieverts.
According to this article, which cites [1] http://www.physics.isu.edu/radinf/natural.htm the average annual exposure to ionizing radiation is 3600 microsieverts. So this is nearly 9.8 microsieverts per day, or 0.4 microsieverts per hour.
The isi.edu page gives the components of this - 16% is from artificial sources and 55% is from breathing radon (a heavy short half-life radioactive gas, which is produced by rocks which contain uranium and therefore, with radioactive decay, radium).
The table at [2] http://www.ornl.gov/sci/env_rpt/aser95/tb-a-2.pdf refers to different doses of radiation in units of "millirem". 1 millirem = 10 microsieverts. The table below is my own compilation of this information, with other sources mentioned below, all in the units of microsieverts and microsieverts per hour. (I have converted the units and in some cases altered figures within a few percentage points to create rounded numbers.)
Please remember that radiation monitoring in Japan typically reported in terms of microsieverts per hour, so it is necessary to consider how many hours this a person would be subject to these levels for.
The other sources of information are [3] MIT: http://mitnse.com/2011/03/16/radiation-introduction-and-radiation-status-for-fukushima/
[4]What Aircrews Should Know About Their Occupational Exposure to Ionizing Radiation
http://www.faa.gov/library/reports/medical/oamtechreports/2000s/media/0316.pdf
Note 1: The FAA explain this figure of 250 millsieverts as raising the risk of developing cancer by 1%. This is presumably means 1% more of all the people exposed to this will contract cancer, rather than raising the existing risk of contracting cancer by 1%. The figure applies to long-term occupational exposure, for people 20 to 64 years old. The impact of this quantity of radiation on younger people, including children, babies and babies in-utero, would (I guess) be higher than this. Also, (I guess) short term exposure to the same quantity of radiation may be more damaging than if it is spread over decades. Both these guesses are consistent with the 0.8% cancer risk in the item above, for 100,000 microsieverts.
has some limitations. (The following notes are from 2011-03-18.) Firstly, many prefectures have no sensors. Secondly, in some prefectures which do, including Fukushima and to the north, Miyagi, there are no results. They are depicted as "under survey". It is unclear whether this is due to official suppression of figures, or to the entire sensor network in each prefecture not working.
Two non-official sites concerning radiation levels are:
This page http://www.pref.tochigi.lg.jp/kinkyu/houshasen.html links to a PDF (with an name which depends on the date and time) the most recent radiation readings in Utsunomiya, the capital of Tochigi prefecture, about 150km to the south-west of Fukushima Dia-Ichi. I have not been able to read these PDFs. I found it convenient to open the above page with Google's Chrome browser, which offered an English translation. The second green heading and the text which follows, is translated by Google into the following:
The last dose of the situation
Heisei 23 March twenty-two now at twelve
0.153 microsievert Tochigi Public Health and Environment / hour.
Nasu Town Hall microsievert 0.56 / hour.
Imaichi Health Center microsievert 0.55 / hour.
Haga building microsievert 0.12 / hour.
Oyama City Hall microsievert 0.18 / hour.
These Numbers, IT Does not Affect Health (Ref: Chest X-Ray Microsievert sixty.)
Even without translation, using Firefox, these figures are visible amongst the Japanese characters.
Radiation measurements are in the past - and safety decisions need to be made according to our expectations of the future. The wind could change and the emissions from the reactors could change. So I think it is vital to avoid being downwind of the reactors . . . but what distances should we worry about? I have no idea, since no-one knows how much radiation the reactors will be putting out. We don't even have a clear idea of how much radiation the reactors have emitted so far, since most of it has been blown out to sea. Since the reactors could emit more, due to explosions, meltdowns or deliberate or accidental release of radioactive steam or other gasses, no-one can reliably predict what they will emit.
The figures at the above site are in nanogray per hour (nanojoules of energy per kilogram of absorbing material, per hour. According to http://en.wikipedia.org/wiki/Ionizing_radiation#Units the gray and the sievert are different types of unit, so there is no direct conversion between nanograys or similar and microsieverts.
According to this article, which cites [1] http://www.physics.isu.edu/radinf/natural.htm the average annual exposure to ionizing radiation is 3600 microsieverts. So this is nearly 9.8 microsieverts per day, or 0.4 microsieverts per hour.
The isi.edu page gives the components of this - 16% is from artificial sources and 55% is from breathing radon (a heavy short half-life radioactive gas, which is produced by rocks which contain uranium and therefore, with radioactive decay, radium).
The table at [2] http://www.ornl.gov/sci/env_rpt/aser95/tb-a-2.pdf refers to different doses of radiation in units of "millirem". 1 millirem = 10 microsieverts. The table below is my own compilation of this information, with other sources mentioned below, all in the units of microsieverts and microsieverts per hour. (I have converted the units and in some cases altered figures within a few percentage points to create rounded numbers.)
Please remember that radiation monitoring in Japan typically reported in terms of microsieverts per hour, so it is necessary to consider how many hours this a person would be subject to these levels for.
| Description and [source] |
Total dose in microsieverts |
Approximately how many microsieverts per hour, if this level was exper- ienced for one day this would be equal to. (Column 2 divided by 24) |
Likewise, in microsieverts per hour, but if the exposure
was for one week. (Column 2 divided by 168) |
| Approx daily background dose,
including from radon. [1] [2] [3] |
10 |
0.4 |
0.06 |
| Cosmic rays from one-way flight
from New York to Los Angeles. [2] |
25 |
1.0 |
0.15 |
| Cosmic ray exposure flying Tokyo to New York. [4] |
70 |
3.0 |
0.33 |
| Chest X-ray. [3] |
80 |
3.3 |
0.5 |
| Average annual occupational dose
of radiation workers in USA (1980). [2] |
1,100 |
46 |
6.5 |
| Approx annual background dose,
including from radon. [1] [2] [3] |
3,600 |
150 |
21 |
| CT-scan of abdomen. [3] |
8,000 |
333 |
48 |
| Level at which EPA Protective
Action Guidelines state that public officials should take emergency action when this is a probable dose to a member
of the public from a nuclear accident. [2] |
10,000 to 50,000 |
420 to 2,100 |
60 to 300 |
| Annual limit for occupational
exposure of radiation workers set by the U.S. Nuclear Regulatory Commission and DOE. [2] |
50,000 |
2,100 (AKA 2.1 millisieverts) |
300 |
| Estimated level at which an
acute dose would result in a lifetime excess risk of death from cancer 0.8%. [2] |
100,000 |
4,200 |
600 |
| Increased lifetime risk of cancer raised by 1% [4] (See note 1.) |
250,000 |
10,000 |
1,500 |
| Level at which doses received
over a short period of time produce radiation sickness in varying degrees. At the lower end of this range, people are expected to recover completely, given proper medical attention. At the top of this range, most people will die within 60 days. [2] |
500,000 to 6,000,000 |
21,000 to 252,000 | 3,000 to 36,000 |
The other sources of information are [3] MIT: http://mitnse.com/2011/03/16/radiation-introduction-and-radiation-status-for-fukushima/
[4]What Aircrews Should Know About Their Occupational Exposure to Ionizing Radiation
http://www.faa.gov/library/reports/medical/oamtechreports/2000s/media/0316.pdf
Note 1: The FAA explain this figure of 250 millsieverts as raising the risk of developing cancer by 1%. This is presumably means 1% more of all the people exposed to this will contract cancer, rather than raising the existing risk of contracting cancer by 1%. The figure applies to long-term occupational exposure, for people 20 to 64 years old. The impact of this quantity of radiation on younger people, including children, babies and babies in-utero, would (I guess) be higher than this. Also, (I guess) short term exposure to the same quantity of radiation may be more damaging than if it is spread over decades. Both these guesses are consistent with the 0.8% cancer risk in the item above, for 100,000 microsieverts.
[#weather]
Weather information
Weather charts. Firstly,
the Japanese Weather Bureau's current
page. From this there are archived pages and two weather prediction
charts.
It can be quite hard to see the outline of Japan in these charts. The prediction charts are especially important, and contain arrows for wind direction. In the northern hemisphere, low pressure systems rotate anti-clockwise and highs clockwise. (So what are the arrows in the prediction charts, pointing clockwise in the low pressure system?) The general drift of the systems is west to east at present.
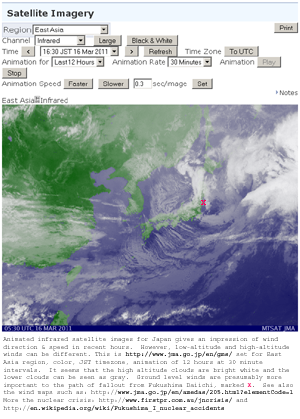
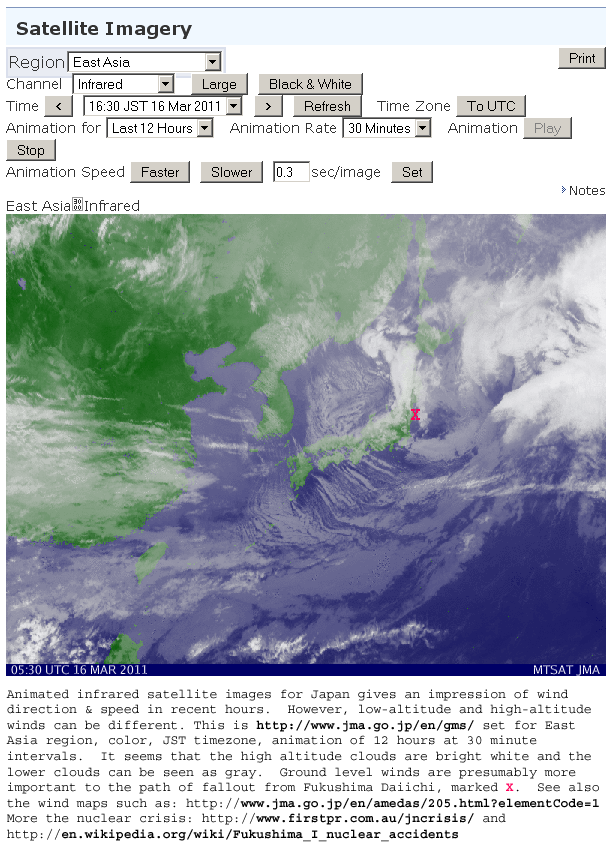
The following page has infrared satellite images which can be animated. I suggest 12 or more hours of animation in 30 minute steps, with color turned on, for the East Asia region. This gives a an impression of the general direction of wind up to the present time.
It seems that the bright white clouds are high altitude and the gray ones are low altitude. I guess that the low-altitude ones are more important, since the contaminated air from the reactors is unlikely to rise to any great altitude, and because we are concerned about the exposure of people on the ground.
The image below shows what the above page looks like. Click it to see a bigger version, but more importantly, use the link above and the large text wind map links above to find out about wind directions at present.
A more colourful but not necessarily more informative north pacific chart:
An easier to view set of wind directions for the whole country is:
but it is not clear how these are generated. The more detailed maps of the Japan Meteorological Agency linked to above are presumably better.
It can be quite hard to see the outline of Japan in these charts. The prediction charts are especially important, and contain arrows for wind direction. In the northern hemisphere, low pressure systems rotate anti-clockwise and highs clockwise. (So what are the arrows in the prediction charts, pointing clockwise in the low pressure system?) The general drift of the systems is west to east at present.
The following page has infrared satellite images which can be animated. I suggest 12 or more hours of animation in 30 minute steps, with color turned on, for the East Asia region. This gives a an impression of the general direction of wind up to the present time.
It seems that the bright white clouds are high altitude and the gray ones are low altitude. I guess that the low-altitude ones are more important, since the contaminated air from the reactors is unlikely to rise to any great altitude, and because we are concerned about the exposure of people on the ground.
The image below shows what the above page looks like. Click it to see a bigger version, but more importantly, use the link above and the large text wind map links above to find out about wind directions at present.
A more colourful but not necessarily more informative north pacific chart:
An easier to view set of wind directions for the whole country is:
but it is not clear how these are generated. The more detailed maps of the Japan Meteorological Agency linked to above are presumably better.
[#news]
News sites
NHK
Television News in
English:
This is the most immediate and up-to date source of information I know of.
ABC news in Australia has a good record of providing images and videos soon after the events:
The BBC, CNN and various other sites are also good:
[#techsites]
Technical sites
There are extensive, detailed and presumably well informed blog entries and discussions on the crisis at
for instance, this one which points to a paper on localised criticalities (collections of fuel pellets probably at the bottom of the reactor vessel where the fission chain reaction starts up again). Also some thermal images of the reactor buildings on 21 March:
Nature (2011-04-02) has a special (free access) supplement on the earthquake, tsunami and nuclear crisis:
This includes a blog report indicating that the fission chain reaction may have restarted in at least one reactor, with some comments debating this.
Some timely and presumably reliable analysis of the problems with these reactors is at a blog site from MIT Nuclear and Science Engineering http://mitnse.com I think this is excellent information. I won't necessarily be up-to-date with listing their topics, so please check the March archives http://mitnse.com/2011/03/ at this site.
I think (2011-03-19) the most important articles are:
The Japan Atomic Industrial Forum is publishing several updates a day, with a table listing key things about each reactor, its fuel rods and its containment building:
The Nuclear Energy Institute has some information via this page:
Background info on the crisis is here (impossibly long URL).
TEPCO's press release page (might work better with Internet Explorer than Firefox)
World Nuclear News has a bunch of articles on the crisis:
The Nautilus Institute (a public policy think-tank) released a report on the crisis on 2011-03-17:
This contains considerable detail about spent fuel rods, of which there are thousands of tonnes at Fukushima Daiishi.
A highly informative document which appears to be directly relevant to the stricken reactors. Some images from this appear below.
Some other documents from the US Nuclear Regulatory Commission:
There's a 373 page report from the OECD in 2009 on the behaviour of nuclear fuel in Loss of Coolant Accident situations:
Please suggest more sites.
for instance, this one which points to a paper on localised criticalities (collections of fuel pellets probably at the bottom of the reactor vessel where the fission chain reaction starts up again). Also some thermal images of the reactor buildings on 21 March:
http://lewis.armscontrolwonk.com/archive/3822/localized-criticalities-at-fukushima
http://bigdustup.blogspot.com/2011/03/infrared-ir-thermal-images-of-fukushima.html
http://bigdustup.blogspot.com/2011/03/infrared-ir-thermal-images-of-fukushima.html
Nature (2011-04-02) has a special (free access) supplement on the earthquake, tsunami and nuclear crisis:
This includes a blog report indicating that the fission chain reaction may have restarted in at least one reactor, with some comments debating this.
Some timely and presumably reliable analysis of the problems with these reactors is at a blog site from MIT Nuclear and Science Engineering http://mitnse.com I think this is excellent information. I won't necessarily be up-to-date with listing their topics, so please check the March archives http://mitnse.com/2011/03/ at this site.
I think (2011-03-19) the most important articles are:
- mitnse.com/2011/03/15/explanation-of-hydrogen-explosions-at-units-1-and-3/
- mitnse.com/2011/03/15/unit-2-explosion-and-unit-4-spent-fuel-pool-fire/
- http://mitnse.com/2011/03/16/a-primer-on-spent-fuel-pools/
- http://mitnse.com/2011/03/16/what-is-decay-heat/
- http://mitnse.com/2011/03/16/radiation-introduction-and-radiation-status-for-fukushima/
- http://mitnse.com/2011/03/17/a-summary-on-plutonium-in-nuclear-fuel/
- http://mitnse.com/2011/03/17/on-worst-case-scenarios/
- http://mitnse.com/2011/03/17/what-is-an-isotope/
- http://mitnse.com/2011/03/18/news-update-318/
- http://mitnse.com/2011/03/18/what-is-criticality/
The Japan Atomic Industrial Forum is publishing several updates a day, with a table listing key things about each reactor, its fuel rods and its containment building:
The Nuclear Energy Institute has some information via this page:
Background info on the crisis is here (impossibly long URL).
TEPCO's press release page (might work better with Internet Explorer than Firefox)
World Nuclear News has a bunch of articles on the crisis:
The Nautilus Institute (a public policy think-tank) released a report on the crisis on 2011-03-17:
This contains considerable detail about spent fuel rods, of which there are thousands of tonnes at Fukushima Daiishi.
A highly informative document which appears to be directly relevant to the stricken reactors. Some images from this appear below.
Some other documents from the US Nuclear Regulatory Commission:
http://www.nrc.gov/reactors/generic-bwr.pdf
Contains an annotated diagram of the reactor and its secondary
containment structure.
There's a 373 page report from the OECD in 2009 on the behaviour of nuclear fuel in Loss of Coolant Accident situations:
Please suggest more sites.
[#videos]
Videos
This is in date order, so the latest
videos are at the end of this section.
The open-source VLC video player (http://www.videolan.org/vlc/for Windows, Mac, GNU/Linux etc.) should be able to play all these videos. If, for some reason, you can't play the videos from your web browser, you should be able to play them like this: Right click the link, copy the link location (into your computer's clipboard) and then in VLC use File > Open location from clipboard. VLC will play from these files, starting immediately, without having to download the entire video file.
The explosion of Unit 1 on 2011-03-12:
The explosion of Unit 3 on 2011-03-14:
Here is a 52 minute video from NHK TV's
English service. It was from early AM JST on 2011-03-17 and is a
roundup of the nuclear crisis, looking
at all the failures, the
dangers, and the evacuation of residents.
This may have been a replay from the night of 2011-03-16. I think
the translation is done after the initial broadcast, rather than in
real-time.
I missed the very first part of it. It is 128kbps .rm (Real Media) format. It can be played with Real Player (http://www.real.com) at least. However, Real Player may try to download the entire file before it starts to play.
There are 3D graphic models of the reactors, based on the GE diagrams, but they are not necessarily technically accurate. For instance, they depict hydrogen leaving from the top of the core straight through the reactor vessel wall and out of the secondary containment. Still, it is an interesting record of how the Japanese media are presenting this to an increasingly concerned public.
Here is the same program in 10 minute chunks, of about 9MB. The starting times of the files are exact, so times mentioned below can be used to index into chunks.
Some highlights:
2011-03-17 NHK helicopter close-up video of the damaged reactor buildings. Presumably radioactive steam is coming out of some or all of them.
This is from:
I missed the very first part of it. It is 128kbps .rm (Real Media) format. It can be played with Real Player (http://www.real.com) at least. However, Real Player may try to download the entire file before it starts to play.
There are 3D graphic models of the reactors, based on the GE diagrams, but they are not necessarily technically accurate. For instance, they depict hydrogen leaving from the top of the core straight through the reactor vessel wall and out of the secondary containment. Still, it is an interesting record of how the Japanese media are presenting this to an increasingly concerned public.
Here is the same program in 10 minute chunks, of about 9MB. The starting times of the files are exact, so times mentioned below can be used to index into chunks.
video/NHK-WORLD-English-nuclear-crisis-2011-03-17-early-AM-00-10min.rm
video/NHK-WORLD-English-nuclear-crisis-2011-03-17-early-AM-10-20min.rm
video/NHK-WORLD-English-nuclear-crisis-2011-03-17-early-AM-20-30min.rm
video/NHK-WORLD-English-nuclear-crisis-2011-03-17-early-AM-30-40min.rm
video/NHK-WORLD-English-nuclear-crisis-2011-03-17-early-AM-40-52min.rm
video/NHK-WORLD-English-nuclear-crisis-2011-03-17-early-AM-10-20min.rm
video/NHK-WORLD-English-nuclear-crisis-2011-03-17-early-AM-20-30min.rm
video/NHK-WORLD-English-nuclear-crisis-2011-03-17-early-AM-30-40min.rm
video/NHK-WORLD-English-nuclear-crisis-2011-03-17-early-AM-40-52min.rm
Some highlights:
- 2:30 Shows the inside of a reactor-like vessel with water being sprayed.
- 3:20
Graph of tsunami depth taken 45km north of the power plant. The
water dropped and then went to 7.3 metres higher than normal.
- 4:00
"The fuel oil tanks and other facilities along the coastline were all
washed away.
Tsunami waves reached as much as 300 metres from the coastline.
The tsunami waves inundated parts of the facilities of the nuclear
plant. Electrical equipment was soaked in water and this is believed to
be the cause of the emergency core cooling device failure."
(2011-03-18 3:58 JST However, which of the structures near the
waterline before the tsunami, as can be seen from the current Google
Maps image, were the fuel tanks? I can't find a good reference
for this report/allegation that the generator fuel tanks were washed
away by the tsunami.)
2011-03-17 NHK helicopter close-up video of the damaged reactor buildings. Presumably radioactive steam is coming out of some or all of them.
This is from:
[#forums]
Discussion forums
The discussion forum I
established. Please read and contribute!
There's a detailed set of blog entries, with comments, at:
or more generally, for the latest developments:
A roundup on 2011-03-15 is here, pointing to various blog posts at this site and to other information to that date. The author, Prof. Barry Brook, seems to be rather optimistic (crazily and unrealistically so, I think) in writing that the situation is "stabilizing" on 2011-03-16, when there is not even evaporative cooling. I think he overestimates the rate at which decay heat is now declining, perhaps because he believes the decline to be exponential (it's not, see below) and because it initially declines very rapidly.
Theres a small article on cooling the reactors at Scientific American, with some discussion comments from readers:
Some other discussion forums suggested by "gsgs", which I haven't looked at in detail yet:
There must be other significant discussion forums - please let me know of them.
There's a detailed set of blog entries, with comments, at:
or more generally, for the latest developments:
A roundup on 2011-03-15 is here, pointing to various blog posts at this site and to other information to that date. The author, Prof. Barry Brook, seems to be rather optimistic (crazily and unrealistically so, I think) in writing that the situation is "stabilizing" on 2011-03-16, when there is not even evaporative cooling. I think he overestimates the rate at which decay heat is now declining, perhaps because he believes the decline to be exponential (it's not, see below) and because it initially declines very rapidly.
Theres a small article on cooling the reactors at Scientific American, with some discussion comments from readers:
Some other discussion forums suggested by "gsgs", which I haven't looked at in detail yet:
http://thisbluemarble.com/forumdisplay.php?f=8
Multiple threads.
http://www.flutrackers.com/forum/forumdisplay.php?f=2714 multiple threads, including especially, on March 16 and 17, following on from previous threads:
http://www.flutrackers.com/forum/showthread.php?t=164413 .
http://www.intrade.com Multiple threads.
http://www.flutrackers.com/forum/forumdisplay.php?f=2714 multiple threads, including especially, on March 16 and 17, following on from previous threads:
http://www.flutrackers.com/forum/showthread.php?t=164413 .
http://www.intrade.com Multiple threads.
There must be other significant discussion forums - please let me know of them.
[#decayheat]
Decay heat and some explanation of the crisis
Below, is my explanation.
However, please refer to a more informed page:
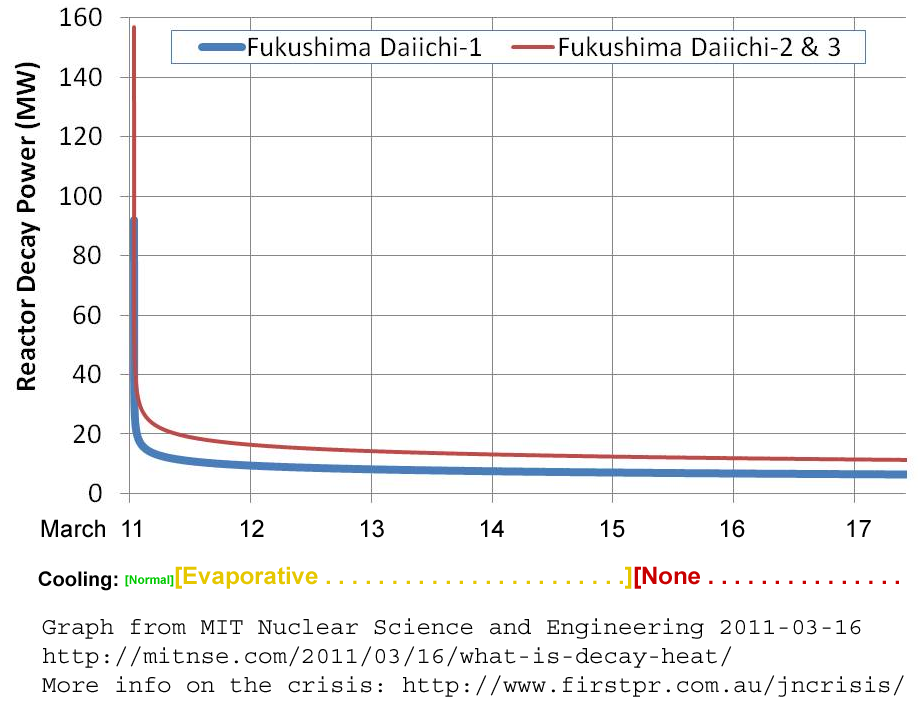
Here is an annotated version of the graph from that page, followed by the figures for the next year from that page, with easier-to-read dates:
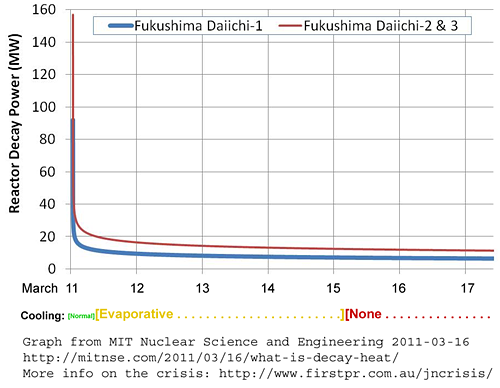
Larger version: Decay-heat-MIT-linear-918-x717.png
Here is an annotated version of the graph from that page, followed by the figures for the next year from that page, with easier-to-read dates:
Larger version: Decay-heat-MIT-linear-918-x717.png
| Date/Time
(Fukushima Time) |
Unit 1 Decay Heat (MW) |
Units 2 & 3 Decay Heat (MW) |
Percent
of Full Reactor Power |
Cooling
arrangements |
| March 11 2:46 PM | 92.0 | 156.8 | 6.60% | Normal |
| March 11 2:47 PM | 44.7 | 76.2 | 3.21% | Normal |
| March 11 2:48 PM | 36.9 | 62.8 | 2.64% | Normal |
| March 11 2:50 PM | 31.4 | 53.5 | 2.25% | Normal |
| March 11 :00 PM | 24.1 | 41.0 | 1.73% | Normal |
| March 11 3:30 PM | 19.1 | 32.5 | 1.37% | Normal |
| March 11 8:00 PM |
12.8 | 21.9 | 0.92% | Normal
till ~ 8 hours after quake |
| March 12 8:00 AM | 10.1 | 17.3 | 0.73% | Evaporative |
| March 12 8:00 PM | 9.1 | 15.5 | 0.65% | Evaporative |
| March 13 | 8.5 | 14.5 | 0.61% | Evaporative |
| March 14 | 7.8 | 13.2 | 0.56% | Evaporative |
| March 16 | 6.9 | 11.8 | 0.50% | None |
| March 20 | 6.1 | 10.5 | 0.44% | ? |
| April 1 | 5.2 | 8.8 | 0.37% | ? |
| July 1 | 3.7 | 6.3 | 0.26% | ? |
| October 1 | 3.3 | 5.6 | 0.23% | ? |
| 2012 March 11 |
2.9 | 5.0 | 0.21% | ? |
See also the article:http://en.wikipedia.org/wiki/Decay_heat
.
These graphs and figures are crucial to understanding the crisis.
After the main fission reaction of the reactors were shut down, in about 4 seconds or so, by the fully raised control "rods", the power output dropped to about 7% of what it had been in the hours, days and weeks beforehand.
This heat is due to the breakdown of the short-lived fission byproducts, which remain within the ceramic fuel. Some of these have a very short half-life, and so they split, emitting energy electrons, alpha-particles (energetic helium nuclei) and/or gamma rays, with lots of heat, generally within minutes. If you have a gram of something with a half-life of an hour, and hour later you will have half a gram of it, and the other half would have turned into some other breakdown products (atoms with smaller nuclei, electrons, helium nuclei etc.), some of the isotopes with smaller nuclei (fewer protons and/or neutrons) may also be radioactive, with their own half life, their own emission of heat and radiation, and perhaps still further radioactive isotopes.
These reactors have electrical outputs of 460MW (megawatts) for Unit 1 and 784MW for Units 2 and 3. The systems are about 33% efficient, so the heat generation by the core, at full power, is three times these figures. This is confirmed by the figures contained in reactor reports at http://www.jaif.or.jp/english/ Unit 1 creates 1,380 MW of heat and units 2 and 3 create 3,381 MW.
The design of the reactors is that when they are shut down suddenly, electrical power is needed to keep water circulating through the reactor core, and to cool this with seawater, which needs to be pumped through heat exchangers (condensers for steam, normally) underneath the turbines. Since all the reactors were stopped suddenly, power needed to come from one or more diesel generators - but they failed after an hour, I understand due to damage from the tsunami. As reported in the 52 minute NHK video archived above, the white cylindrical fuel tanks for the diesel generators were located at the waterfront, and were swept away by the tsunami.
Batteries kept this cooling regime going for another 8 hours. This is when the trouble really started.
Without the ability to pump water through the core and heat exchanger, the operators could only cool the core by pumping water into it, and allowing the resulting steam to escape. A little of this steam might have been able to be released into the secondary containment structure, where it might condense and cool to liquid water, and so not generate too much pressure. But this was apparently not an option and the steam was released to the atmosphere.
Initially, this steam would have been reasonably pure water, with short-lived radioactivity which people should not be near, but which apparently breaks down within minutes or hours.
Without the steam release, pressure would have built up in the reactor vessel to a level which could have caused it to burst, though it is made of 10 to 15cm thick (4" to 6") steel.
However, the operators found it impossible to do this while keeping every part of the fuel rods fully immersed in liquid water. This resulted in some of the upper parts of the rods being only immersed in steam. This caused the fuel rods to become much hotter, to the point where the zirconium metal of the tubes reacted with the equally hot steam to rip the water molecules apart, generating hydrogen gas with the oxygen going to form the white ceramic zirconium dioxide.
This destroys the metal structure of the tube. The helium gas within the tube will then escape (it is there to improve heat transfer between the cylindrical fuel pellets and the inside of the highly conductive metal tubes).
Then water would have entered the tubes, often being heated to form steam. The fuel contains uranium dioxide (and for Unit 3, plutonium dioxide too) and a whole bunch of fission byproducts, including radioactive isotopes with various half-lives. Some of this would go into solution, or suspension as small particles, in the water.
Now, when the steam is vented from the reactor vessel, it carries with it some of the radioactive material which is dispersed or dissolved in the water and steam. This is the primary radioactive danger which the reactors pose from 2011-03-13 and onwards.
The degree to which this radioactivity is released into the atmosphere will depend primarily on the levels of radioactivity in the water/steam in the reactor, and how much steam is vented to the atmosphere. The rate of steam release depends primarily on the amount of heat which is being generated, since this evaporative cooling is the main way of cooling the core. (Some heat can also be taken out via conduction through the steel reactor vessel, such as to a pool of water around the bottom of it.)
So the above graph tells us roughly how much heat needs to be dissipated and how quickly this will diminish in the days and weeks to come.
The explosions, so far, have been caused by the hydrogen mixing with air and being ignited. The hydrogen adds to the pressure inside the reactor vessel and would be released along with the steam.
Whether the hydrogen accumulated and exploded within the secondary containment building (I guess for Unit 3) or just in the roofed top section above the concrete containment (I guess Unit 1), it has somehow exploded. The fact that these explosions happened shows how little control the operators have had over the situation. How hard can it be to ensure hydrogen vents to the atmosphere? It is lighter than air and will float upwards.
The need to cool the core will diminish over time, provided the fuel rods do not melt together or collapse. However, it will take until July before there is a halving of the energy output of 2011-03-16.
If the fuel concentrates itself, either as loose pellets and or as molten ceramic fuel, it could, in principle, start up the fission reaction again, since it is no longer separated by space and by the control "rods". This is unlikely, since the fuel used in these reactors is not highly refined beyond 5% or so (the uranium-235 or plutonium-239 used in nuclear weapons is highly refined - 90% or more). Furthermore, the fission reaction in reactors depends largely on a medium which "moderates" neutrons - slows them down. Only neutrons slowed down to the ordinary velocities of atoms around room temperature to 800C or so, so they are traveling at about 1km a second or so, react strongly with fissile U235 and Pu239 to split them, so continuing the fission reaction. This neutron moderator role is performed by water, in these reactions, but a molten mass of fuel will have no water within it.
So a bomb-like chain reaction is unlikely in the molten fuel mass, which is known as "corium" and resembles lava from a volcano. But a restarting of the fission chain reaction is not needed for this molten mass to get hotter and hotter. Just the decay heat will cause it to heat up, unless all that heat is removed by some means. It won't be if there is a big mass of this stuff - tens of tonnes of molten fuel, and any other muck which has been caught up in it. Molten corium can melt through the steel reactor vessel and can melt concrete, which then becomes part of the corium. Any remaining zirconium in the corium can oxidize - catch fire - so providing a chemical source of heat in addition to the decay heat.
To read more about this:
Then, it may get hotter and hotter, and could melt its way through the steel reactor body, and then fall into the secondary containment area below which is designed to split it up and send it into the water-filled torus, where it should hopefully be able to dissipate its heat better and cool down. Still, the decay heat will be released, and some of this heat will be released by that now radioactive water boiling as well.
Hot corium will also emit radioactive material into the air.
So the race is to keep the core cool, without it disintegrating any
more, while emitting as little vapor as possible, until the whole thing
can be cooled without emitting any steam at all. Then, the
reactor vessel can be sealed, and with continual cooling, it will
reduce its heat output in the months to come and it could be dismantled
and cleaned up.
This process will surely take months.
So the direction of the wind is really important.
This process will surely take months.
So the direction of the wind is really important.
[#images]
Images
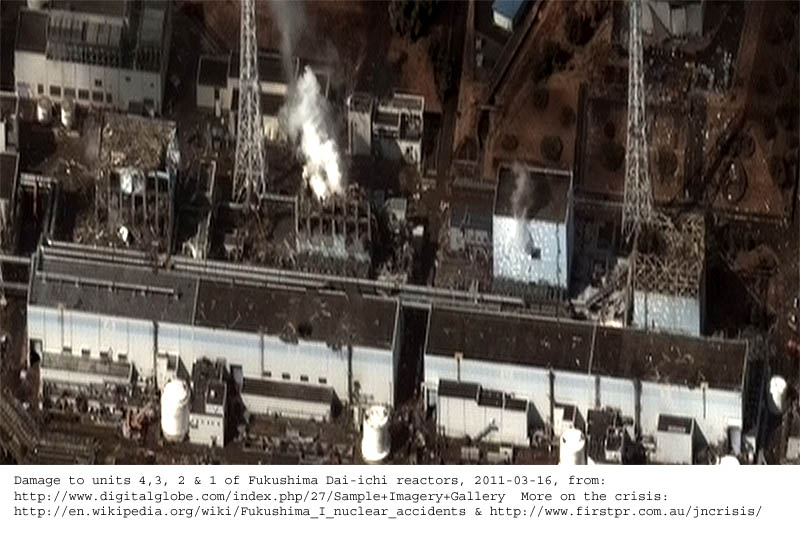
Here are various images which I think
are worth archiving and making easily available. I have added
captions to them so they remain self-explanatory, in English at least,
no matter where they are copied.
(Added 2011-04-01) Detailed photos taken on 2011-03-20 by a drone aircraft:
(Added 2011-03-26) There are some photos of inside the damaged control rooms and other parts of the site at:
These were taken on 2011-03-23. (In case the above file disappears, a copy is in the current directory, so append nisa.meti.go.jp-en20110325-1-5.pdf to the www.firstpr.com.au/jncrisis/ URL.)
This page at DigitalGlobe.com has the latest satellite images:
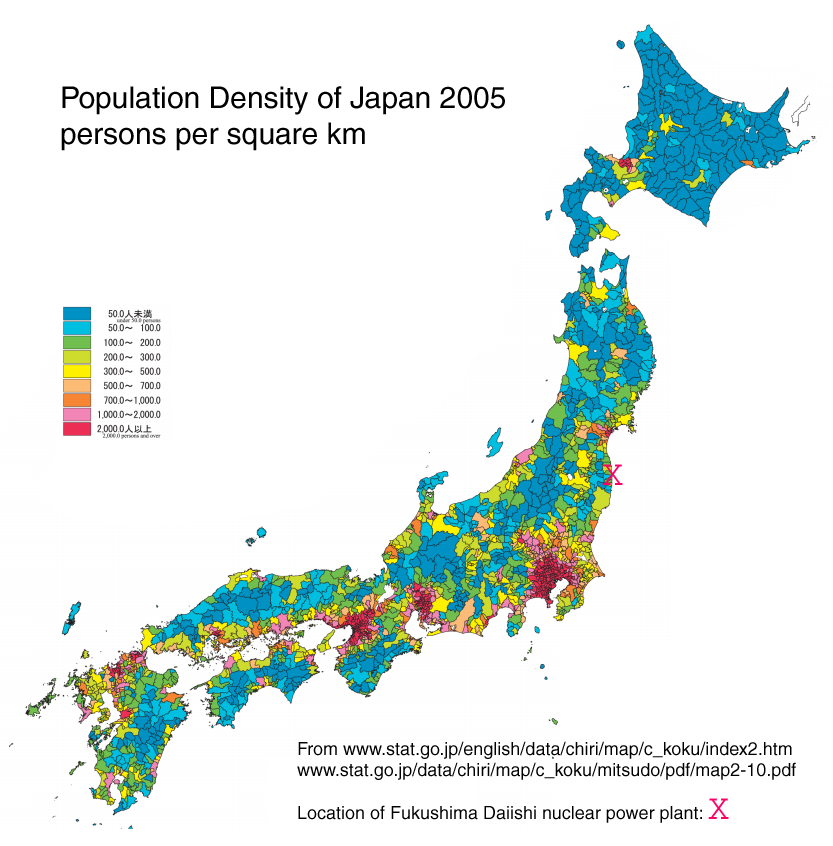
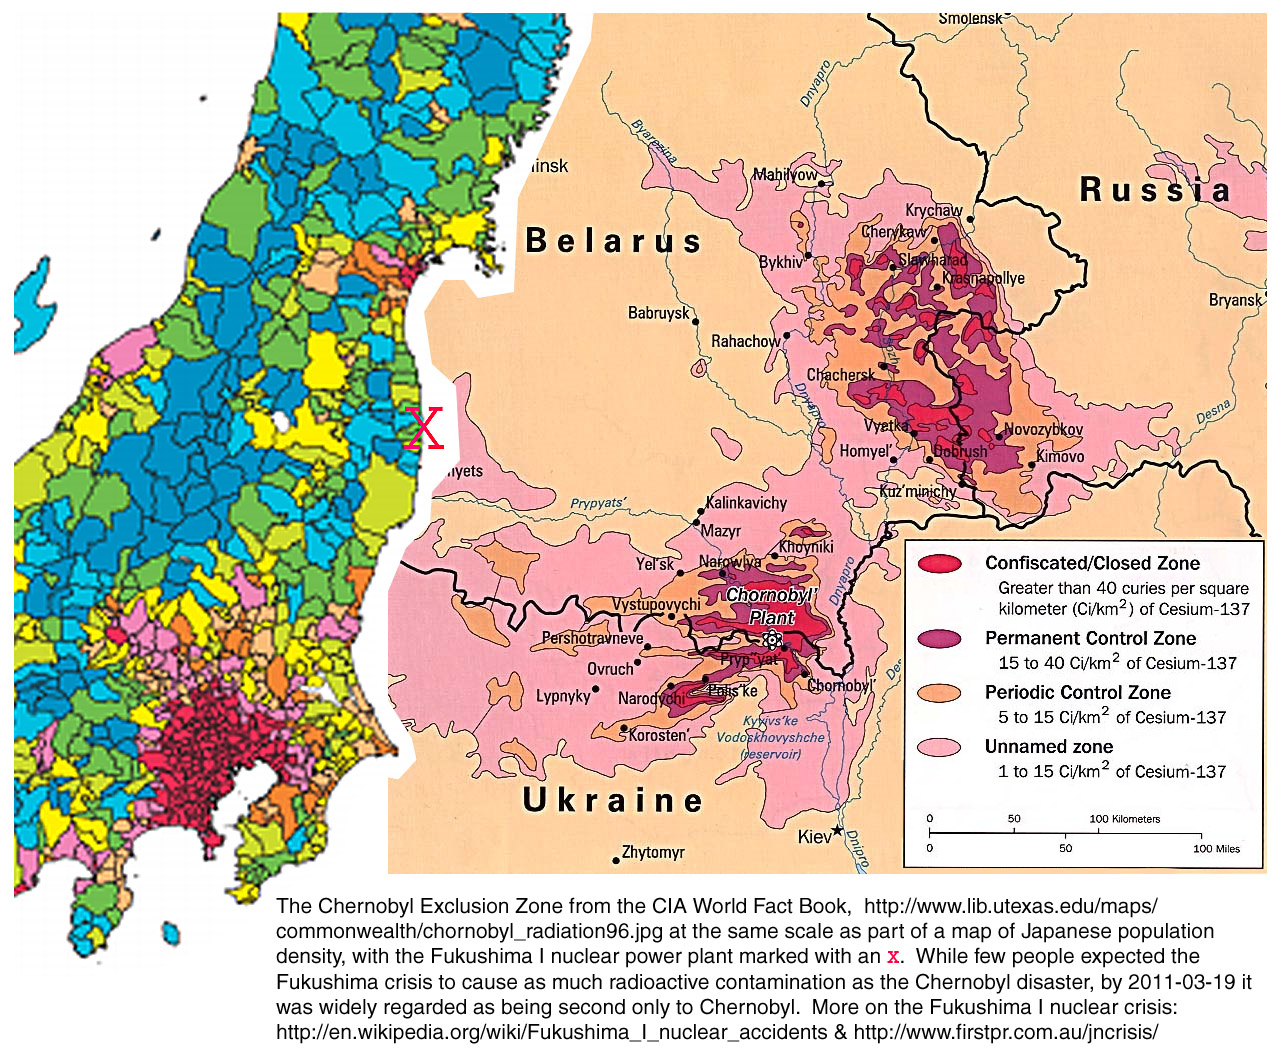
I made the following map to depict the
contaminated areas around the Chernobyl nuclear power plant at the same
scale as parts of Japan around the Fukushima I nuclear power plant.

Here is a larger version: Japan-Fukushima-Chernobyl-maps-to-scale-1284x1064.jpg
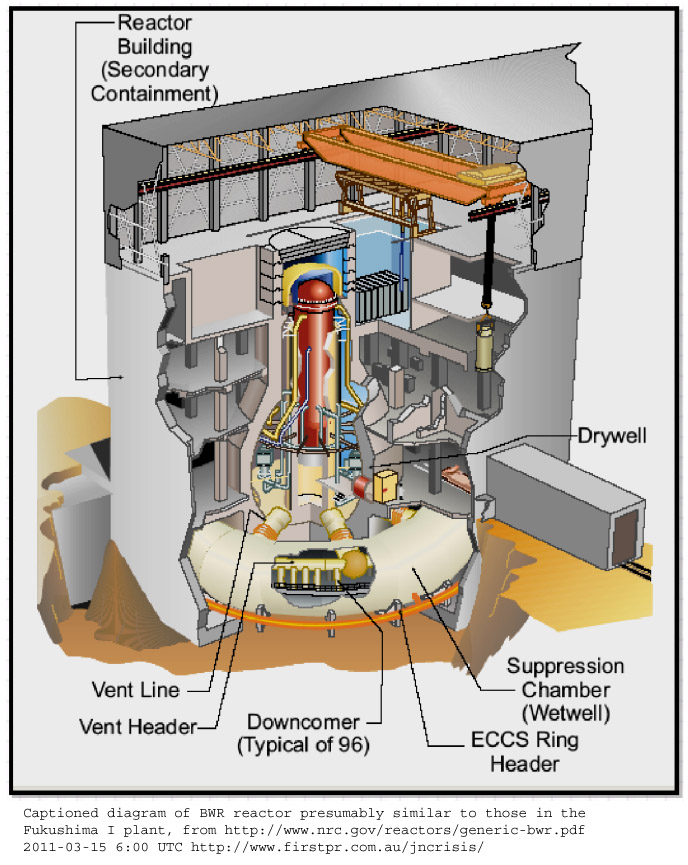
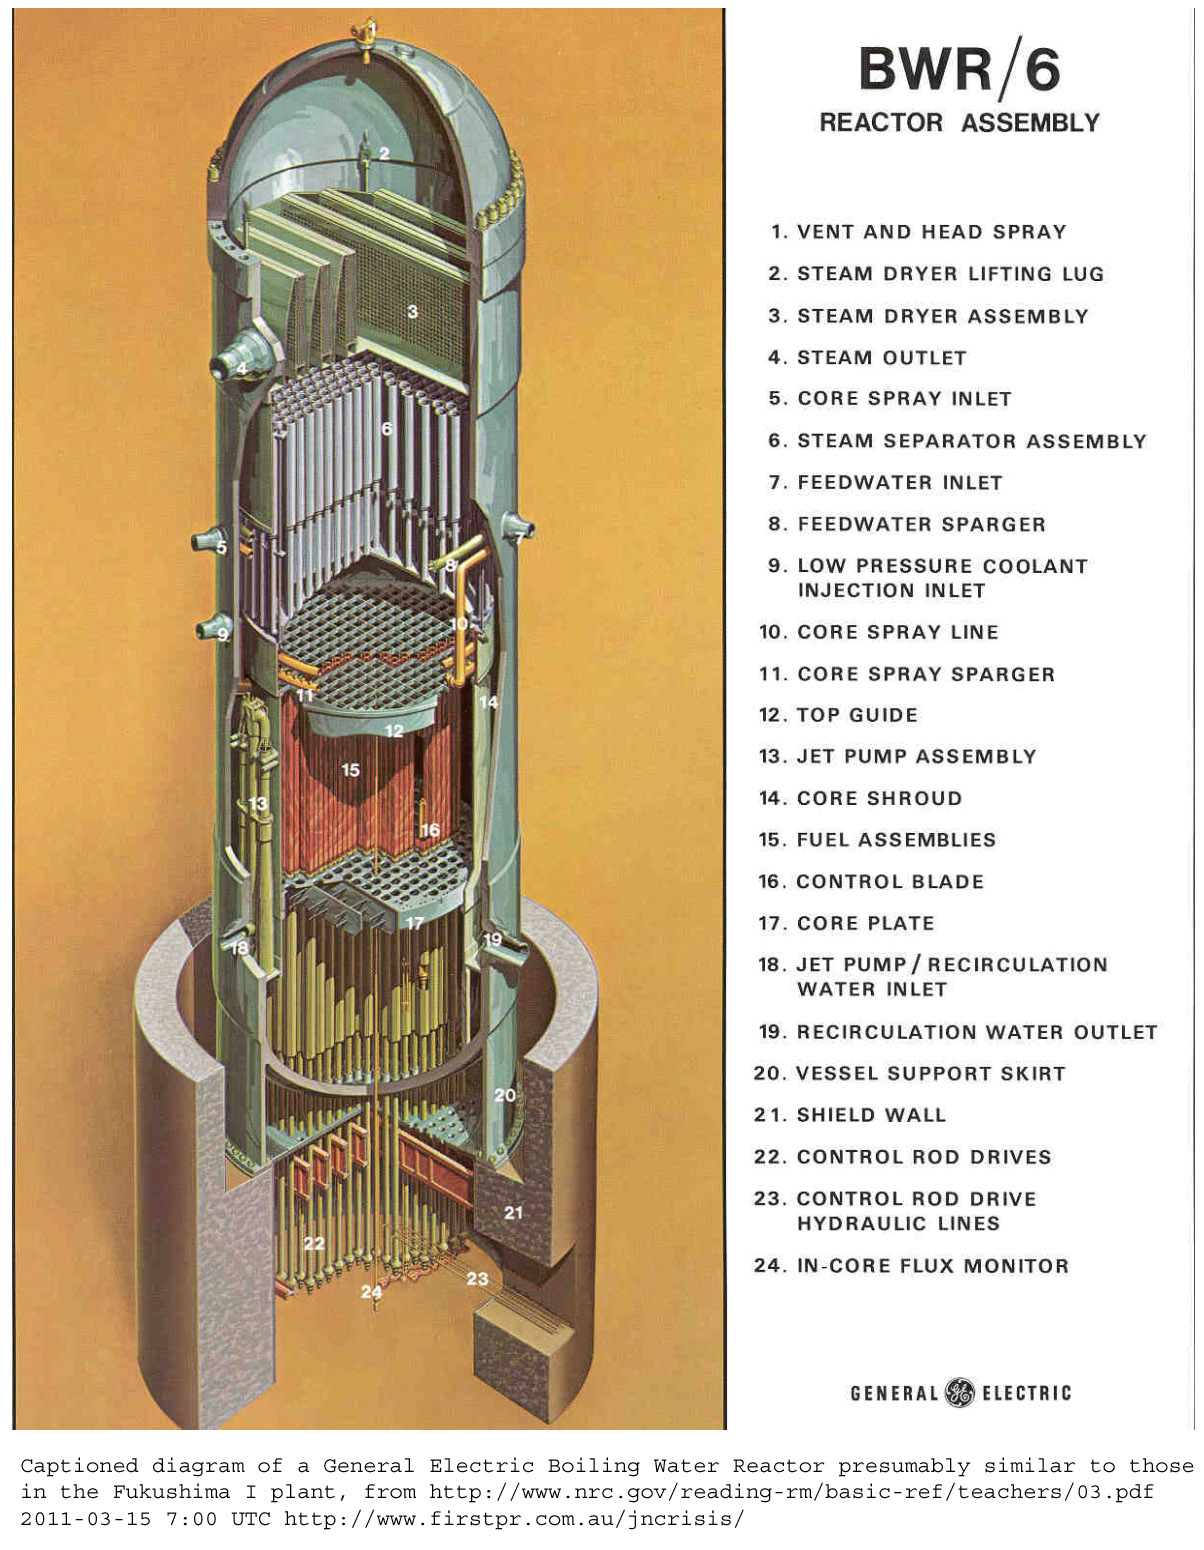
Larger version: Boiling-Water-Reactor-cutaway-diagram-from-NRC.GOV-1142x1292.jpg
There are photos below of a US reactor which show parts of the top of the above structure, including the yellow dome.
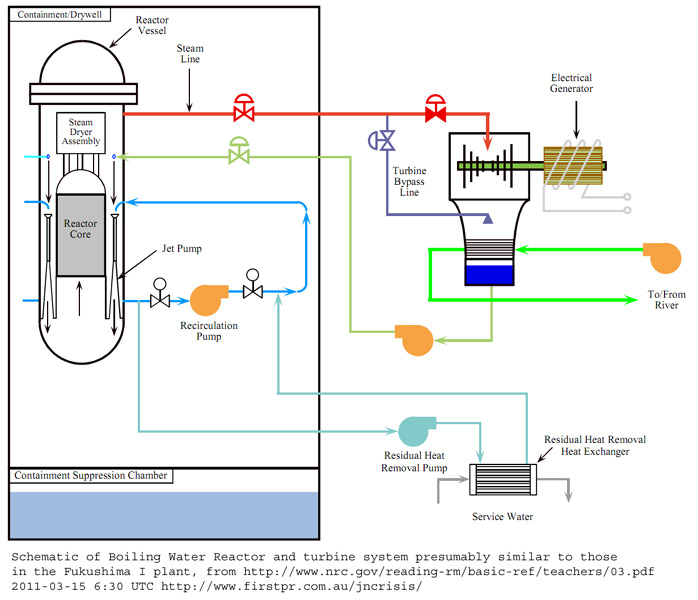
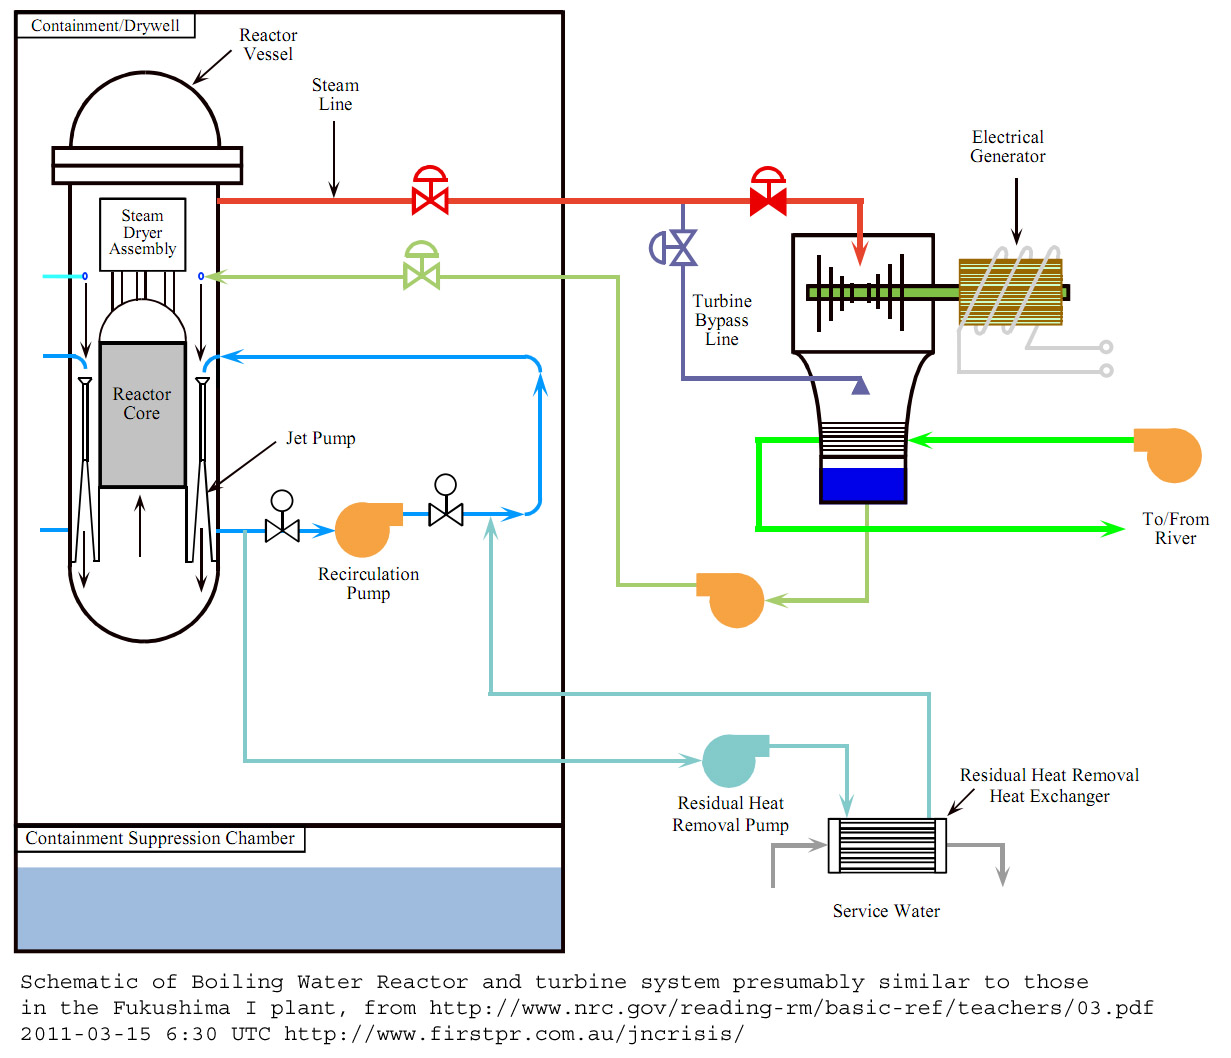
Larger version: Boiling-Water-Reactor-system-schematic-from-NRC.GOV-1271x1058.jpg

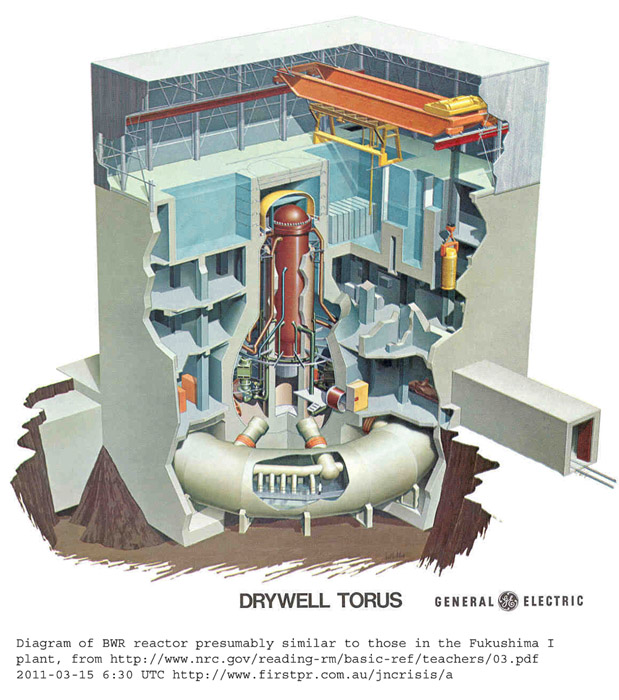
Larger version: Boiling-Water-Reactor-diagram-from-NRC.GOV-1204x1550.jpg
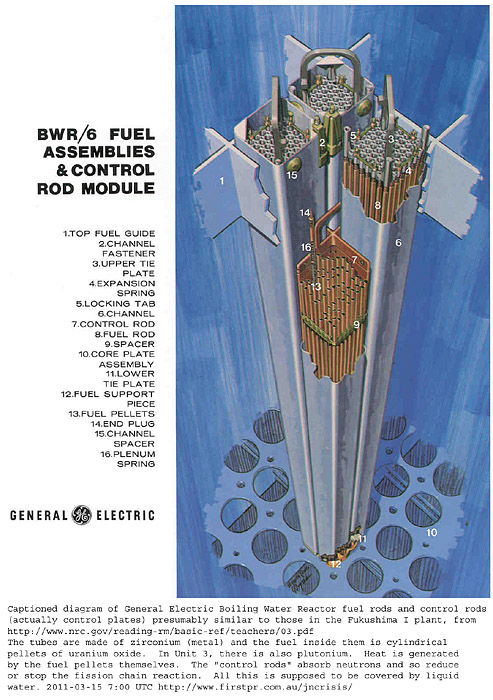
Larger version: BWR-fuel-and-control-rods-diagram-from-NRC.GOV-1167x1657.jpg
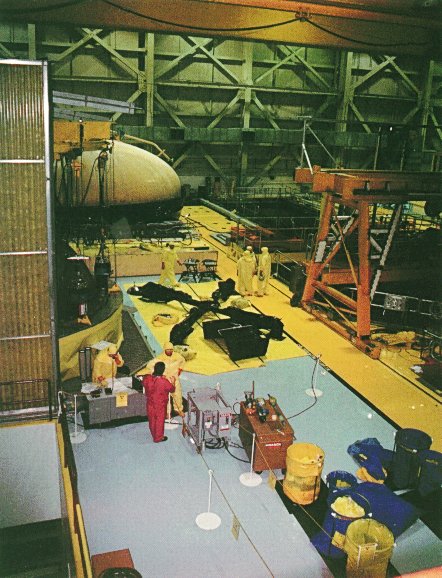
Some images which I suggest looking at from the most informative
page. These are for http://www.nucleartourist.com/areas/bwr-in1.htm
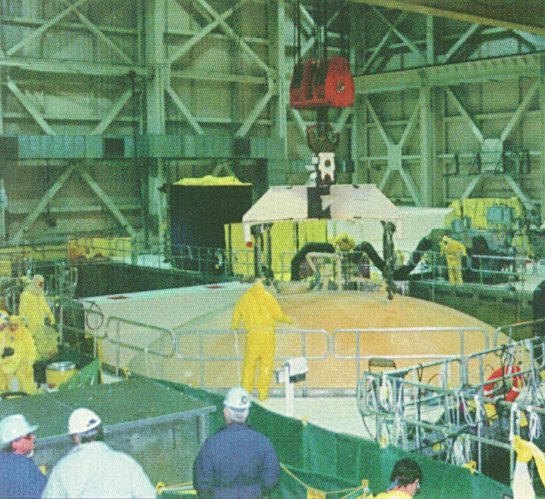
http://www.nucleartourist.com/images/headlift.jpg
Removing the yellow dome which forms part of the secondary containment. This is in the "refueling floor" area which was blown open and exposed with the explosion of Unit 1.
http://www.nucleartourist.com/images/rflg-fl2.jpg
The refelling floor during a the refueling shut-down.
http://www.nucleartourist.com/images/rflg-fl1.jpg
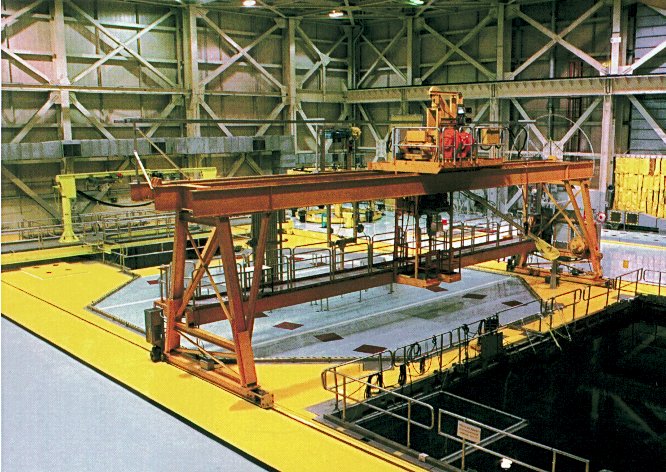
The refueling floor during reactor operation. The yellow dome would be beneath this.
http://www.nucleartourist.com/images/torus1.jpg
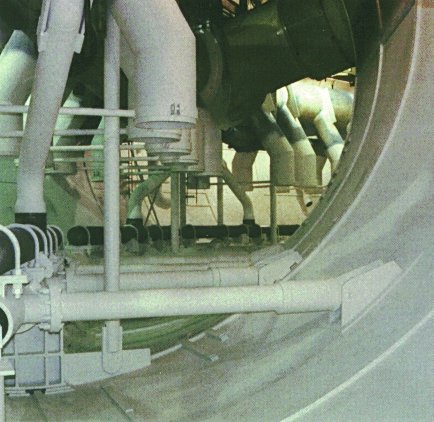
Inside the torus. If the core melts, collects in the bottom of the reactor vessel, melts the steel of that vessel (15cm = 6" thick, I think) the molten material is supposed to flow into pipes which distribute it around the torus, where it is cooled by water and dispersed. This is to reduce the chance of the 100 tonnes or so of radioactive fuel from forming a critical mass and continuing the fission reaction which heats it acutely and which could lead to a bomb-like explosion.
http://www.nucleartourist.com/images/bwr-cyc1.jpg
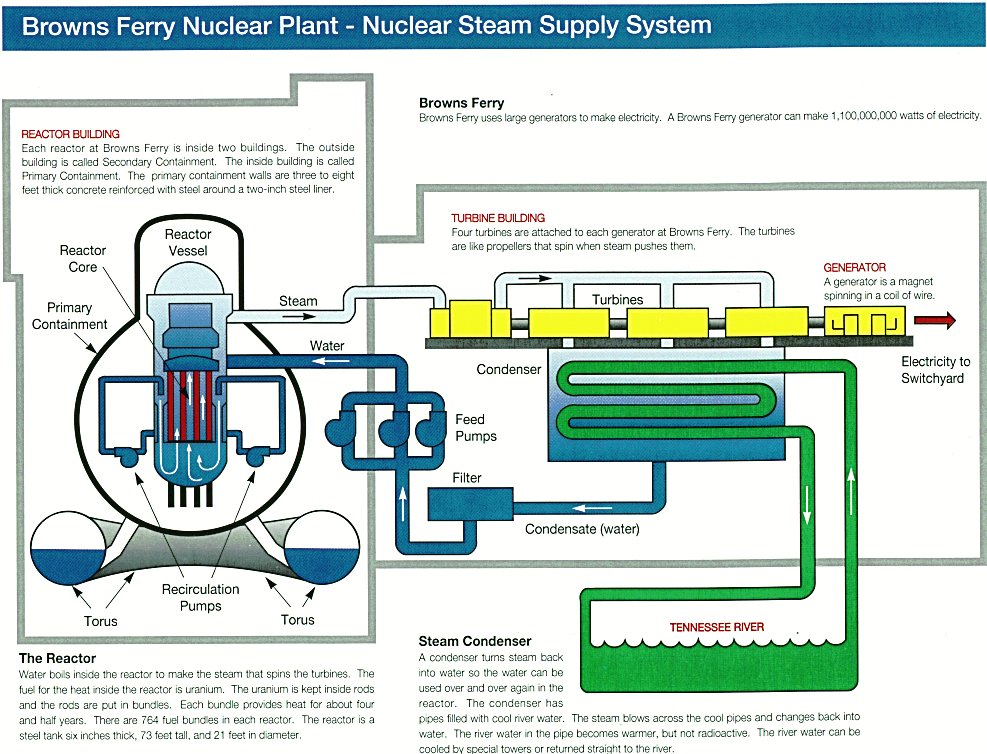
This shows a schematic of the reactor
vessel, turbines, heat-exchanger (condenser) and cooling water, which
in the case of the Fukushima reactors, is seawater.
http://www.nucleartourist.com/images/Finsp1.gif
Small photo showing the top of a fuel
assembly. This gives an idea of the diameter of the fuel rods.
http://www.nucleartourist.com/images/Cr-core1.gif
Part of the control room's display of the bundles of fuel rods.
http://www.nucleartourist.com/areas/bwr-in1.htm
When the reactor is closed for refueling, the lid is removed and the rods are still generating some heat. The radiation causes Cerenkov radiation http://en.wikipedia.org/wiki/Cerenkov_radiation in the water. Particles such as electrons are emitted during radioactive decay and travel through the water at a velocity faster than the speed of light in water. Bundles of used fuel rods are lifted out of the core and new ones lowered into place.
The control "rods" would be fully up while all this occurring. Also, this would take place (I guess) some weeks or months after the rods stopped the main fission reaction. This allows the decay heat http://en.wikipedia.org/wiki/Decay_heat to be very much reduced from its initially very high level when fission is stopped.
http://www.nucleartourist.com/images/Bwrturb1.gif
Turbine room with concrete block shielding, due to the steam in the turbine, which is boiled in the core, having high levels of radiation.
Latest developments and a few comments
Starting 2011-03-17, here is a list of
developments. It is not at all comprehensive. Be sure to
see the Wikipedia article and timeline for more complete information:
JST is 9 hours ahead of UTC (London), two hours behind Australian Eastern Daylight Savings time, 13 hours ahead of US east coast time and 16 hours ahead of US Pacific coast time.
JST is 9 hours ahead of UTC (London), two hours behind Australian Eastern Daylight Savings time, 13 hours ahead of US east coast time and 16 hours ahead of US Pacific coast time.
2011-03-17 11:42 JST
Workers are back at the plant and there are plans for pumping water into the reactor buildings. NHK TV showed helicopters dumping 7.5 tonnes of seawater, but it was largely ineffective (as acknowledged by the commentators) because the helicopters were flying well above the reactor buildings (I guess several hundred feet) and were moving fast as the dropped the water.
There two major items of good news, in my view, is that Mother Nature's Wind Department is still keeping the air moving offshore, and that there have been no obvious explosions or meltdowns, despite a day or so in which I understand no fresh water was pumped into the reactors of units 1, 2 or 3, or into the pool of water which houses the fuel rods from unit 4, which was shut down about 115 days ago (?? this figure is from memory).
2011-03-20 3:20 JST
I understand the fuel rods in the storage pools have been covered with water again. This should reduce emissions and the danger of these rods melting and emitting more radiation.
Still, there are three reactors which have been running without water (AFAIK) for two or more days. The fact that these reactors have not, (AFAIK), melted down or emitted vastly greater amounts of radiation is most encouraging. It was and still is reasonable to expect their cores to melt, and perhaps to melt through the reactor vessel if they are not constantly cooled by liquid water.
The amount of radiation which has been emitted to the atmosphere is completely unknown, because it has generally been blown out to sea, where there are no radiation monitors.
The saving grace of this whole crisis has been the wind generally blowing out to sea. As far as I know, most people in Japan have not experienced radiation exposure which would significantly damage their health. This would not be true of the reactor workers, or of some people living near to the plant.
Hopefully, in the days to come, the reactors will be cooled, initially evaporatively (which means radioactive steam will be emitted). I wonder when the decay heat will be low enough that they could be cooled by having enough water in the reactors to cover the cores, and then sealing the reactors against steam release, and so not using evaporative cooling, but instead pouring water on the outside of the reactor vessel to cool the entire reactor in this manner. This would involve some evaporation, but that would be evaporating fresh seawater, which would not involve release of radioactivity to the atmosphere. Constant flows of water such as this would wash radioactivity from the inside of the secondary containment buildings out to sea, but I guess this would be less of a problem than using evaporative cooling of the reactor water itself.
[#latest]
Most recent entry
2011-03-22 13:25 JST
This time last week, one really bad thing happened after another, explosions and for a day or two complete withdrawal of people from the site. Now we have gone for five days or so without any new explosions and with more people and equipment on the scene. Generally, the wind has been blowing the emissions out to sea.
While radiation levels have not been excessive for most Japanese people, radiation has been detected in food. The latest report from the BBC indicates the operators still have no way of knowing what is going on inside the reactor buildings. I assume most or all of the instrumentation and pumps have been disabled by explosion or fire damage.
So we still have three reactors with damaged cores, in badly damaged buildings, with little or nothing in the way of sensors or ordinary cooling arrangements, plus in unit 4, a large quantity of fuel rods which have been exposed above water to high temperatures and fire and which are now apparently being kept underwater . . . but there seems to be a leak in the pool.
Hopefully the wind will continue blowing out to sea.
[#dangers]
Dangers of various forms of power
Nuclear power is well known for its
complexity, cost and the dangers involved - when operating, if
attacked, and with profound long-term safety problems with the spent
fuel and decommissioning of the reactor. Nuclear power is unique
in that it can cause acute problems with radiation, cancer on a mass
scale and contamination of whole areas of land. This could be the
outcome of the Japanese crisis, if one of the cores melts down, or if
the current cooling difficulties continue and the wind blew from the
east.
Coal fired power stations have their own problems, not least global warming. I recall reading that coal-fired stations emit more radiation than nuclear power stations, due to the radioactive elements in the coal being dispersed into the atmosphere. (Does anyone have a reference?)
I guess that in principle it would be possible to design a nuclear plant which was much more failsafe than these 1960 BWR designs. Still, the problem of the waste remains. I had a look at http://en.wikipedia.org/wiki/Thorium_fuel_cycle . It looks complex and there is still the need for reactors, handling and processing waste, with some long-lived radioactive by-products.
Unless someone can trick small nuclei to come together with ultrasound or some other tricks, I think fusion energy is a long way from being practical. Again, its a big-science, high-tech, complex and dangerous business.
I hope that in Australia especially, we can develop large-scale solar power plants, perhaps based on solar thermal designs which store the heat for hours or a day or so, enabling generation into the night. Until we do, we are going to be burning a lot of black and brown coal and so seriously contributing to global warming.